In this example, we will learn how to configure and run a Multi-Echelon GFA experiment in anyLogistix.
This example is a part of a sequence of scenarios:
- GFA Cold Chain — a scenario for finding warehouse locations using Greenfield Analysis.
- GFA Cold Chain (Multi-Echelon) — a scenario for finding a location of the main distribution center based on warehouse locations.
- SIM Cold Chain (Safety Stock Estimation) — a scenario for adjusting inventory policies to decrease carrying cost and improve Service level.
- SIM Cold Chain (Risk Analysis) — a scenario for testing the supply chain, constructed in previous steps in case of unpredicted events occurring.
All the input data is observed in the previous step of this sequence. Also, on the previous step with the aid of Greenfield analysis, we estimated the number of regional sites and their locations (considering the maximum distance between drugstores and facilities). The next step is a multi-echelon GFA. We can run the experiment as a GFA experiment with or without roads. This experiment allows to find an optimal number of distribution centers as well as define the approximate locations for the supply chain sites with minimum input data:
- First echelon sites locations
- Customers locations
- List of products
- Aggregated demand for each customer
This scenario was made by converting the results of the GFA with roads experiment from the previous step to the GFA scenario.
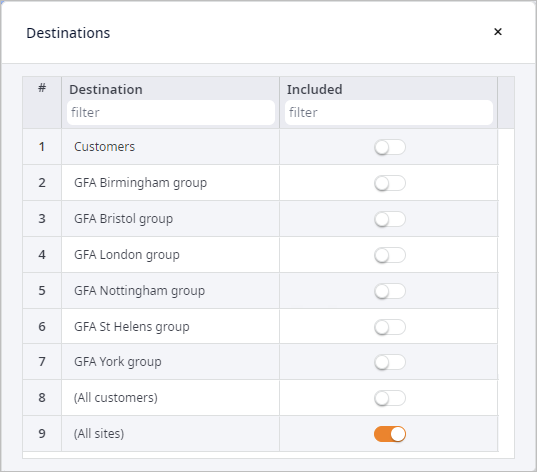
To configure Multi-Echelon GFA we need to open GFA experiment settings, select elements of the previous echelon of the supply chain from the list of groups, and then run the GFA experiment. We can select only groups of objects, so we need to make sure, that we have a group with the required objects defined in the scenario Groups table.

Find location for the distribution center, which will supply regional sites.
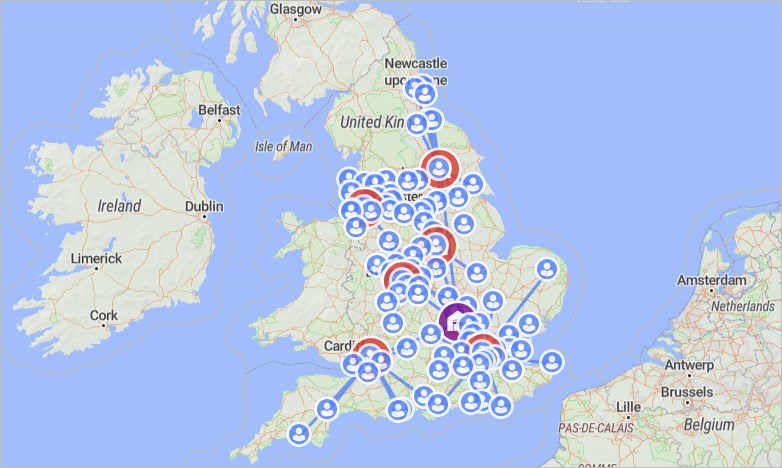
To fulfill the goal, we need to run the GFA experiment for the group, which contains all the warehouses found in the previous step. Since our scenario is a converted result of the previous GFA experiment, we already have the required group. We need to make sure that the proper group is selected and run the experiment. The result of the experiment contains a distribution center located near Leighton Buzzard.

The data on product flows, distance coverage by demand, and demand coverage by distance is shown in the corresponding tables.
- Product Flows — shows detailed statistics on the flows of the supply chain within the specified period of time.
- New Site Locations — shows information on all the new sites created by the experiment.
- Distance Coverage by Demand — shows detailed statistics on the distance to cover to satisfy a certain percentage of the demand.
- Demand Coverage by Distance (and total demand) — shows detailed statistics on the demand to satisfy within a certain distance per site created by the GFA experiment.
In the next step of this sequence (SIM Cold Chain (Safety Stock Estimation)) we will improve inventory policies to increase the service level.
-
How can we improve this article?
-

