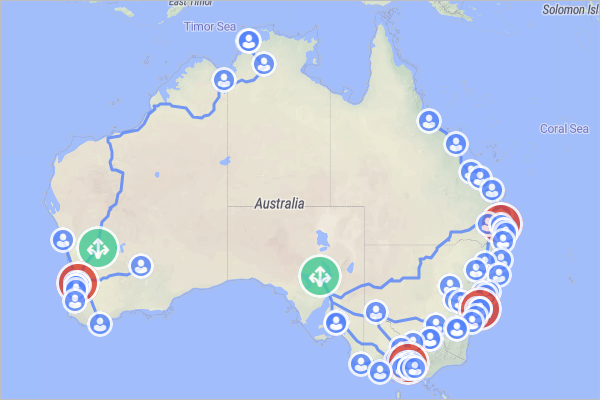
In this scenario, we will learn how to use GFA with roads experiment to find the best locations for distribution centers in the cities with a population of more than 15000 people, and considering transportation by actual roads.
We consider the existing beef supply chain in Australia comprising:
- 3 beef stations which supply beef to the customers
- 100 customers located in the largest cities of Australia
We will suppose that:
- The supply chain covers 10% of total demand of the cities
- Transportation cost from the suppliers to the distribution centers is twice less than the cost of transportation from the distribution centers to the customers
We do not deal with absolute value of the transportation cost, but the ratio of transportation cost applied to two echelons is important because it affects the optimal locations of the distribution centers.
Find the best places for 4 distribution centers in cities with minimum population of 15,000 people considering movement on roads as well as known locations of suppliers and customers.
Let us run the GFA with roads experiment.
The result of the experiment (with the optimal locations of distribution centers considering all the defined restrictions) is available in the New Site Locations page.

The data on product flows, distance coverage by demand and demand coverage by distance is given in the corresponding tables:
- Product Flows — shows detailed statistics on the flows of the supply chain within the specified period:
- Flow — the amount of product
- Distance — the distance between the source and the destination of the product
- Flow Cost Estimation — the estimated cost of the product flow
- Distance Coverage by Demand — shows detailed statistics on the distance to cover to satisfy a certain percentage of the demand:
- Demand (%) – the fraction of demand satisfied
- Demand (kg) — the satisfied demand
- Distance to Site — the distance to cover to satisfy the corresponding amount of demand
- Demand Coverage by Distance (and total demand)- shows detailed statistics on the demand to satisfy within a certain distance per site created by the GFA experiment:
- Distance to Site — the covered distance
- Demand (%) — the fraction of demand satisfied within the corresponding covered distance
- Demand (kg) — the satisfied demand within the corresponding covered distance
-
How can we improve this article?
-

