

The Workspace of a project is the default mode, to which a user is taken from the Home page after opening a
project in the anyLogistix Professional or anyLogistix Professional Server editions.
in the PLE edition a user is taken to the Workspace directly after launching anyLogistix, since the project is created and opened automatically:
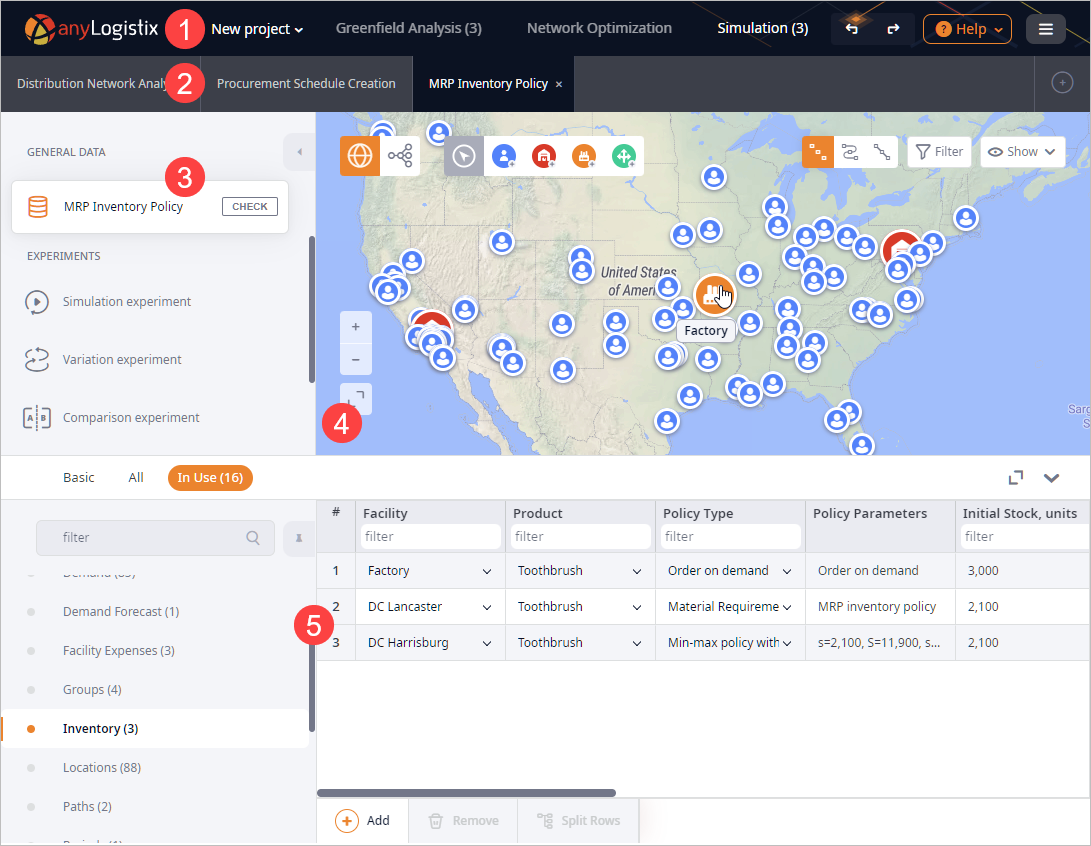
- 1. Toolbar
-

The administrator's toolbar in the Control Panel differs.
The toolbar comprises:
- Projects' name.
-
Controls:
-
 Undo — allows you to undo the previous action.
-
 Redo — allows you to redo the previously undone action.
-
 Preferences — opens the drop-down menu:
-
 Settings — opens the dialog box, allowing you to configure
settings.
Settings — opens the dialog box, allowing you to configure
settings.
-
 Edit Icons — opens the
Edit icons dialog box, allowing you to manage icons for the objects of your supply chain scenarios.
Edit Icons — opens the
Edit icons dialog box, allowing you to manage icons for the objects of your supply chain scenarios.
-
 Manage Units — opens the dialog box with
project units and their conversions.
Manage Units — opens the dialog box with
project units and their conversions.
-
 External Services — opens the
External Services dialog box.
External Services — opens the
External Services dialog box.
-
 Manage Users — [available in anyLogistix Professional Server only] opens the
Manage Users
dialog box, allowing you to share access to this project with the required users.
Manage Users — [available in anyLogistix Professional Server only] opens the
Manage Users
dialog box, allowing you to share access to this project with the required users.
-
-
 Help — opens the drop-down menu:
-
Help — opens anyLogistix help.
-
 Tutorials — opens the
Tutorials section of the anyLogistix help.
Tutorials — opens the
Tutorials section of the anyLogistix help.
-
 Get Support — [not available in the PLE edition] opens the
Get support dialog box.
Get Support — [not available in the PLE edition] opens the
Get support dialog box.
-
 Show Logs — opens the .log file in the plain text editor (downloads the .log file in anyLogistix Professional Server).
-
 Feature Request — opens the
dialog box, allowing you to express your ideas on new features that may improve anyLogistix.
Feature Request — opens the
dialog box, allowing you to express your ideas on new features that may improve anyLogistix.
-
 Get API Libraries — [available in anyLogistix Professional Server only]
opens the Get API Libraries dialog box.
Get API Libraries — [available in anyLogistix Professional Server only]
opens the Get API Libraries dialog box.
-
 About — opens the About dialog box.
Here you can find information about the current version number, product edition, support and license expiration dates.
About — opens the About dialog box.
Here you can find information about the current version number, product edition, support and license expiration dates.
- Information banners — [available if there are unread notifications] the source of information (news, updates, etc.).
-
-
Profile — [available in anyLogistix Professional Server only] opens the drop-down menu with:
-
 License — opens the
License Information dialog box.
If required you can drop your license here.
License — opens the
License Information dialog box.
If required you can drop your license here.
-
 Log out — [available in anyLogistix Professional Server only] signs the current user out of the account that is being used.
The email of the current user is shown next to the Log out control.
Log out — [available in anyLogistix Professional Server only] signs the current user out of the account that is being used.
The email of the current user is shown next to the Log out control.
-
-
 Mode selector — opens the drop-down menu with the working modes.
The icon of this menu depends on the currently active mode:
Mode selector — opens the drop-down menu with the working modes.
The icon of this menu depends on the currently active mode:
-
 Workspace — [the default mode] contains all the tools for creating
and optimizing supply chains.
Workspace — [the default mode] contains all the tools for creating
and optimizing supply chains.
-
 Control panel — [not available in the PLE edition] opens the
Control Panel for observing and maintaining multi-user cooperation.
Control panel — [not available in the PLE edition] opens the
Control Panel for observing and maintaining multi-user cooperation.
-
- Close project — closes the current project and opens the Home page dialog box allowing you to choose other project to open.
-
- 2. Scenarios ribbon
-

Contains the currently open scenarios of all types and controls, allowing you to work with the scenarios:
If the ribbon can't fit in all the open scenarios:
- Hover your mouse over the ribbon and scroll the mouse wheel to turn the carousel and navigate to the required scenario.
- The Closed list becomes enabled, allowing you to explore all the scenarios the ribbon contains.
Scenario tiles show experiment status if it has been launched.
To reorder scenarios in the ribbon simply click and drag the required scenario to the desired position.
-
 Add — opens the menu, allowing you to:
-
 Create scenario — opens the Create Scenario
dialog box, allowing you to define parameters and create new scenario.
Create scenario — opens the Create Scenario
dialog box, allowing you to define parameters and create new scenario.
-
 Import scenarios — opens the
Import Scenarios dialog box, allowing you to import a supply chain scenario from
the MS Excel file or a database.
Import scenarios — opens the
Import Scenarios dialog box, allowing you to import a supply chain scenario from
the MS Excel file or a database.
-
 Explore examples — opens the
Explore Examples dialog box with a list of available examples.
Explore examples — opens the
Explore Examples dialog box with a list of available examples.
-
-
Scenarios filter — filters the open scenarios in the scenarios ribbon:
- All types — [selected by default] select this option to keep scenarios of all types in the ribbon.
-
Greenfield analysis — select this option to keep only scenarios of the
 type in the ribbon.
-
Network optimization — select this option to keep only scenarios of the
 type in the ribbon.
-
Simulation — select this option to keep only scenarios of the
 type in the ribbon.
-
 Closed — opens the list with the
closed scenarios.
Closed — opens the list with the
closed scenarios.
In the multi-user version scenario tiles have tooltips that show the owner/creator of the scenario.

On returning to anyLogistix Workspace (from closing a tab or after logging out) a user will be taken to the scenario, that was open on leaving the Workspace.
- 3. Input data and experiments
-
Contains experiments and their results, controls for validating data and switching between the supply chain and experiment modes.
This section can be minimized to offer more map space.
- GENERAL DATA

- MRP Inventory Policy — the tile shows the name of the scenario you are working with. When clicked the tile switches the layout to the supply chain mode (the default mode) that contains the input tables in the dashboard below the map.
- Check — checks scenario for data inconsistency.
-
EXPERIMENTS — contains experiments of this scenario type, and their outputs.
The number next to the experiment name defines the number of available outputs (results).

To minimize / expand this section.
-
Click
 on the right border of this section.
The section will be minimized. You will now see only icons of the actions.
- Click the control again to return to the default view.
- GENERAL DATA
- 4. Map
-
The map displays the elements of the supply chain scenario and their connections.
- 5. Dashboard
-
The content of the dashboard depends on the mode:
- In the data supply chain mode (the default mode) the dashboard contains the list of tables and the table editor.
- In the experiment mode the statistics dashboard contains either a dashboard menu (in case of simulation based experiments), or a list of results (in case of Network optimization experiment).
The left part of the dashboard can be minimized, the height of the dashboard can be changed.
 — expands the dashboard, places it over the map.
When clicked, the icon is substituted with
— expands the dashboard, places it over the map.
When clicked, the icon is substituted with  .
. — hides the dashboard, providing more space for the map.
To minimize left part of the dashboard
-
Click
 to minimize the list of tables or pages (depends on the mode you are in:
supply chain mode, experiment mode).
The icon will change to
to minimize the list of tables or pages (depends on the mode you are in:
supply chain mode, experiment mode).
The icon will change to  .
The minimized section will now show the name of the currently open table or a dashboard page (depends on the mode you are in) and the
.
The minimized section will now show the name of the currently open table or a dashboard page (depends on the mode you are in) and the
 Show list icon.
-
You can now click the Show list icon open the list over the currently open table or
dashboard elements (depends on the mode you are in).
The icon will change to
 Hide list.
To change the height of the dashboard
- Hover your mouse over the top border of the dashboard. The top border will be highlighted in orange.
- Left-click and drag the top border of the dashboard up or down to increase or decrease the size of the dashboard area.
- Release the mouse button when the top border is at the desired position.
- To set the default height of the dashboard double-click its top border.
-
How can we improve this article?
-