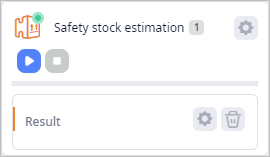
Results of the Safety stock estimation experiment contain:
- Properly configured inventory policies with the optimized safety stock.
- Optimal product stock volume.
- No lost / dropped / delayed orders / ordered products.
The results are available in the dashboard below the experiment's view in the form of statistics. If required, you can rename, remove a page, or export the content of the page's statistics to an MS Excel file.
Safety Stock in Product Units — the gathered data shows the amount of products (per replication) in the specified measurement units that must be kept as a safety stock at a particular site per period.
In case of multiple replications the safety stock amount will be calculated as mean value, i.e., by adding the received safety stock amounts from each replication and dividing the resulting value by the number of replications.
To see experiment results
- Run the experiment.
- Once the experiment is completed, a new Result item will be created below the
Safety stock estimation tile.

- Click Result to analyze the obtained data, if you have previously navigated away from it.
The saved results can be exported to an MS Excel file or converted to the SIM scenario.
-
How can we improve this article?
-

