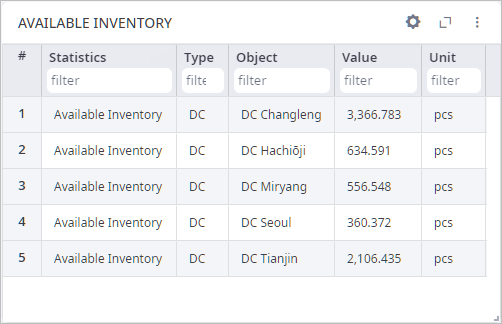
Table is the visualization method for a dashboard element that presents the statistics data in tabular form (in rows and columns). You can:
- Rearrange columns.
- Sort columns.
- Filter columns.
- Group table data.
- Set aggregate function for columns.

-
How can we improve this article?
-

