KPI ribbon is enabled by default and is available below the dashboard toolbar in the experiment mode.
The ribbon contains tiles of the defined KPI metrics and a set of controls allowing you to manage the metrics: add, compare, reorder, remove.
To enable / disable the KPI ribbon
- Select the tile of the required experiment to switch the dashboard to the experiment mode.
-
In the dashboard toolbar click
 KPI settings.
- Click the Show KPI ribbon toggle button to enable / disable the ribbon.
To scroll the ribbon sideways (in case the added metrics do not fit in the visible area), hover your mouse over the ribbon and roll the mouse wheel up or down.

The set of controls depends on the experiment type.
-
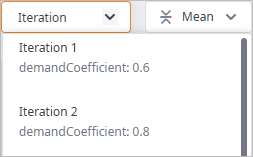
Iteration — [available in results of experiments that use iterations] the experiment run iteration within this result, for which the data is shown.
Each iteration in the drop-down list has a description with the variable parameter's values.

-
Filter of value types to show in KPI tiles.
This filter is:
- Available only for experiments with replications.
- Hidden if Large KPI metric tiles is enabled in the KPI settings. In this case all value types are shown in the enlarged KPI tiles.
The Max / Mean / Min filter:
- Max — calculated maximum value of the collected statistics' values.
- Mean — [selected by default] calculated arithmetic average of the collected statistics' values.
- Min — calculated minimum value of the collected statistics' values.
-
KPI metric tiles — show the required KPI values in the default or large size.
By default the ribbon already contains a set of the predefined metrics.
The set of available metrics differs depending on the experiment.
Each KPI tile comprises:
-
 — the drag-and-drop icon allows you to reorder the KPI tiles in the ribbon.
- The name of the key performance indicator.
- The value of the key performance indicator. If replications were used, then the shown value is defined by the filter. If large tiles are used, all (max, mean, min) values are shown in tiles.
- The value, by which the current KPI differs from the compared KPI.
-
-
 — Click to add KPI metrics to the ribbon.
This control is not available when all the KPI metrics are already added to the ribbon.
To reorder KPI tiles in the ribbon
-
Hover your mouse over the
 icon on the required KPI tile, then click and drag the tile to the new position.

- Release the mouse button when done.
-
How can we improve this article?
-

