

In this example we will learn how to optimize a reverse logistics supply chain. We are going to learn how to create the output product flow from the customers to be able to dispose or recycle and return the recycled materials upstream.
The company owns the Bottle Factory that uses High-Density Polyethylene (HDPE) to produce plastic bottles. The new bottles are shipped to the Chemical Factory where they are filled with detergent and disinfectant chemicals. The bottled chemicals are then delivered to the customers through the distribution centers. The used empty bottles are later gathered in the collector facilities to be sent to the recycling or disposal facilities. The polyethylene received throughout the recycling will be sent to the Bottles Factory for new bottles production.
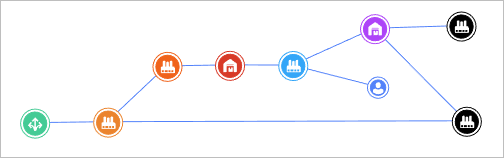
The supply chain comprises:
- 1 HDPE supplier.
- 1 Bottle Factory.
- 1 Chemical Factory.
- 3 Distribution centers.
- 50 Customers in Spain.
- 50 Customer storage objects, modeled as a Factories to represent the de-bottling process.
- 1 recycling factory, where the part of the used bottles will be recycled into the HDPE pellets.
- 1 Landfill, where the remaining bottles are converted to the waste.
Customers in anyLogistix are simple objects that create demand based on the defined logic, and receive the demanded products. But in reverse logistics we need to collect products from customers, so we need customers to have the availability to store and send products.
This can be done by attaching a shadow object to each customer (placing them in the same locations). Generally, we could use objects of the DC type for this purpose, but in this scenario we want a customer to hand back a type of product that differs from what it initially ordered. A customer orders the chemicals, receives them in the bottles, then hands over the used empty bottles to the collectors. The factory shadow objects will model the empty bottle production process in this case.
We name these shadow facilities Customer Storage and set the ![]() blue icon for them.
blue icon for them.
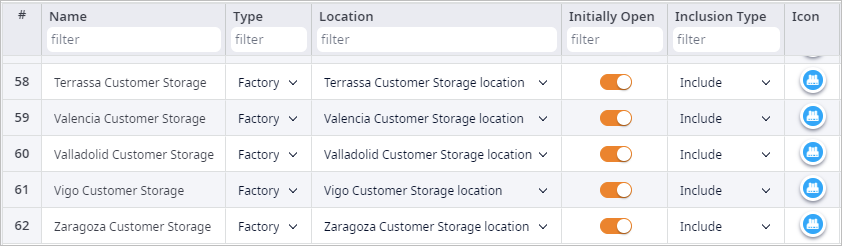
In our supply chain structure they receive the products ordered by the customers, convert them into the chemicals that are sent to the customers, and the used empty bottles that continue their journey throughout the supply chain.
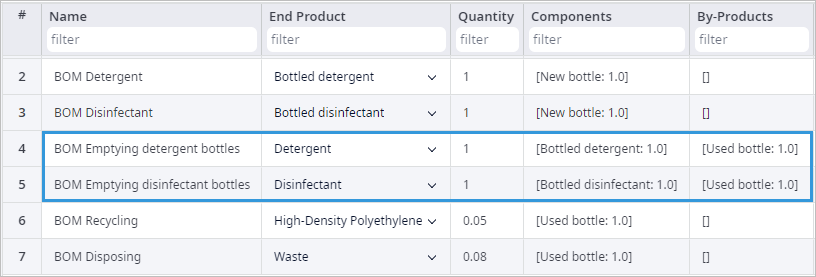
The process of creating new products from the existing ones is described in the Production and the BOM tables. These two tables are usually used together to properly define the production process considering the required components and the possible by-products.
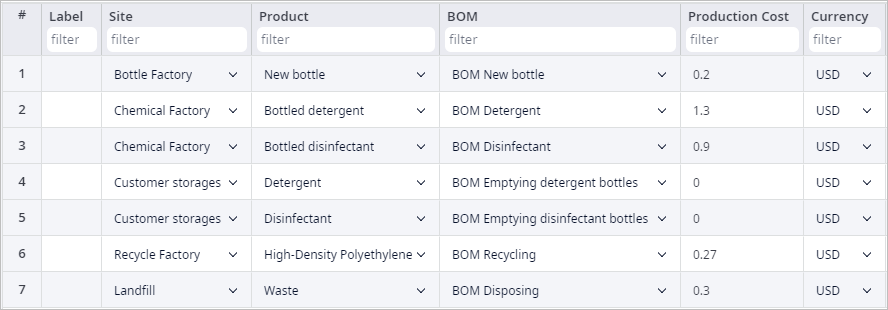
The process of producing new bottles, bottling chemicals, recycling, and disposing the used bottles are also defined through the Production and the BOM tables.
As for the modeling time, we can only operate with periods in the Network Optimization experiment. All the results we get are gathered by the periods. If we use the period of 1 year, we can only obtain results at the end of this year. But if we want to get some more detailed statistics on the state of the supply chain within this the year, we can define smaller periods. But the more periods we use in one scenario, the higher the optimization task complexity is. So, we divided the year period into 12 month-sized periods to get the data we need, and at the same time to keep the complexity at the reasonable level.
The plastic recycling rate increases each year due to the increasing number of the recycling factories. According to statistics the plastic recycling rate is 51% in the Spain. The rest is disposed in the landfills.
We will use the Custom Constraints table to implement this distribution by setting dependencies between each pair of flows (from the collectors to the recycle factory and to the landfill) for all the periods.
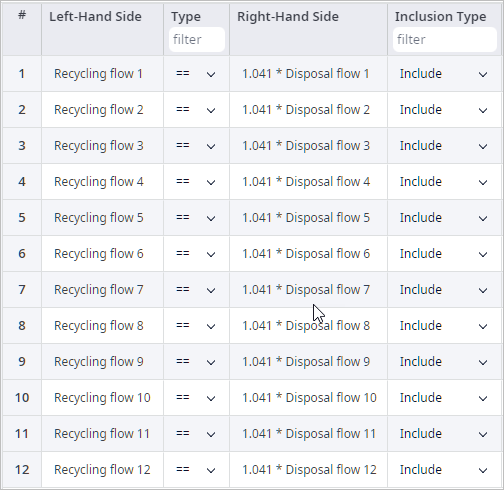
We set the 51/49 ratio between the Recycling and Disposal flows, by setting this equation, where 1.041 = 51/49. This way the used bottles flow will be separated with the defined ratio.
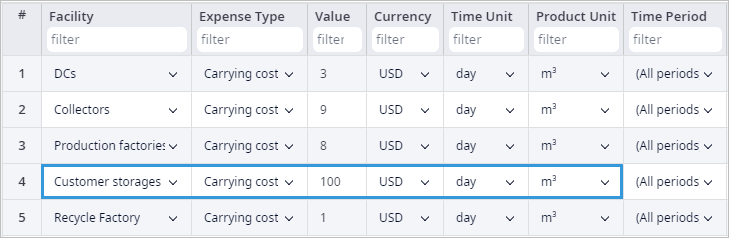
Since we want customer storages to “consume” (de-bottle the chemicals) and send the used bottles for recycling as they arrive, we need to prevent these Factory objects from storing the products. That is why we set a huge carrying cost for them.
Let us run the Network Optimization experiment and observe the collected statistics.
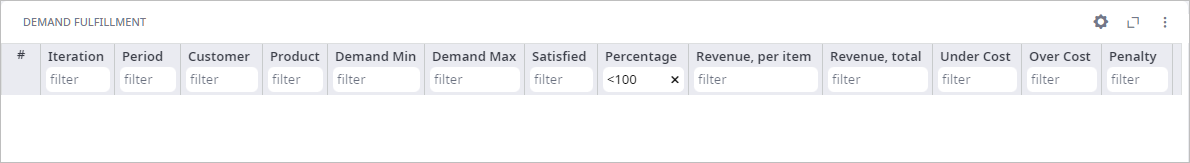
First, we need to check if the demand of the customers is satisfied by the supply chain. We need to open the Demand Fulfillment table and observe the Percentage column. As we can see, there is no unsatisfied demand during the optimization.
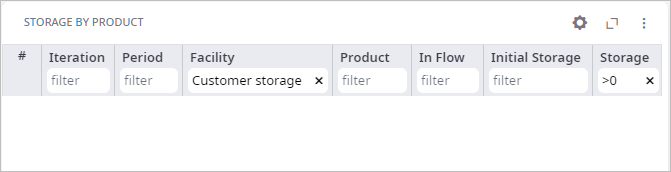
Now we can open the Storage by Product table to check if the Customer Storage facilities are actually storing products. Let us filter the data of the table by the Customer Storage and the >0 in the Facility and Storage columns respectively. We can see that there are no customers with products in stock. So now we are sure that the used bottles are transported from the customer storages to the recycling or disposing facilities.
We can also check if the ratio we set for the used bottle flow in the Custom Constraint table is fulfilled. We need to open the Named Expressions table in the statistics dashboard. Here we can see all the variables we created in the Product flows table. The ratio between the variables referring to the same month is 1.041, as we set earlier.
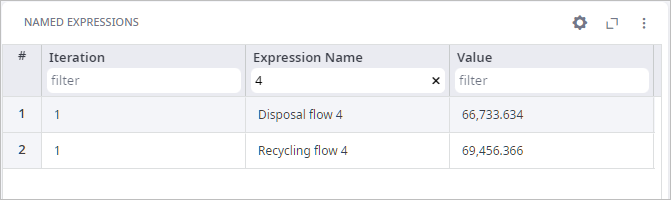
We can see that the flows ratio is fulfilled each month.
The Product Flows table shows the amount of Polyethylene that is created by recycling the used bottles in the Recycle factory, and later transported to the Bottle production factory.
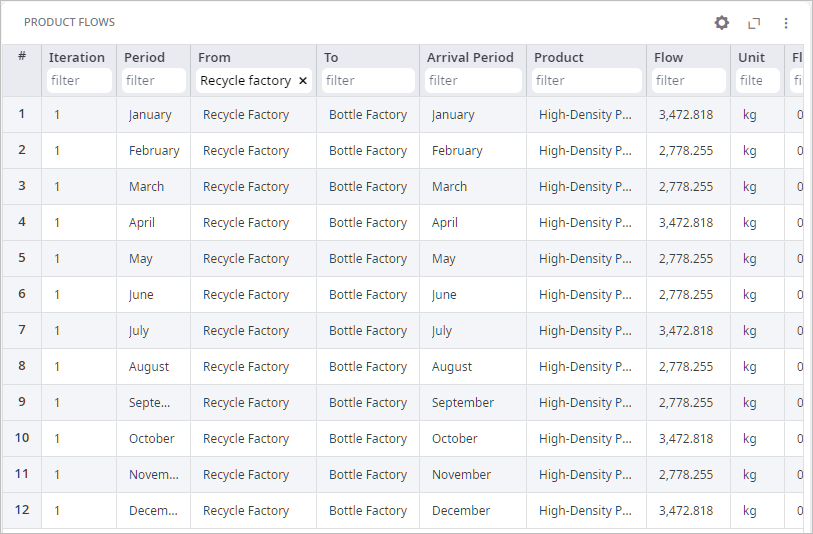
That means that this amount of Polyethylene completed the full Production-Usage-Recycle circle and will be further used in the production of new bottles.
-
How can we improve this article?
-