

In the previous phase we added raw materials, suppliers, and updated the sourcing and the inventory policies. In this phase we will launch production of our end products.
Our supply chain currently has all it takes to start production. The last thing that is left is to define the amount of raw materials required to produce each of our end products.
Let us start with the Food storage container product. The food container and its lid are made from plastic, while the sealing gasket is made from silicon rubber.
Add bill of materials for food containers
- Navigate to the BOM table by typing BOM in the search field.
- Now add a new record by clicking Add.
- Name it Container BOM.
- Specify Food storage container as its End Product.
- Set Quantity to 1712 to define the number of storage containers this BOM produces from the components (raw materials) that we will define with the next step.
- Double-click the Components cell to open the dialog box.
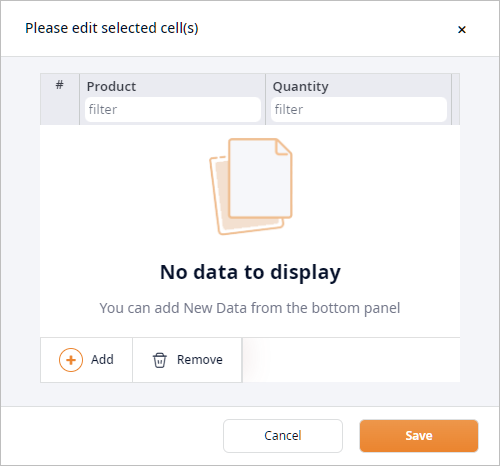
- Click Add to create a new record.
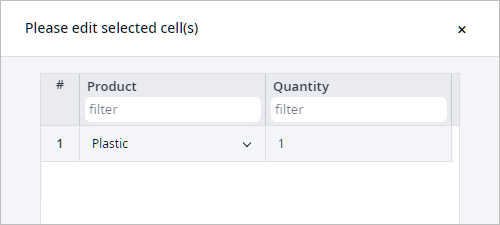
- Double-click the Product cell and select Plastic from the drop-down list.
- In the Quantity cell type 1.
In this way we define that the factory required 1m3 of plastic to produce 1712 food storage containers.
- Repeat steps 7-9 to define that 0.023 m3 of
Silicon is required to produce 1712 seal gaskets.
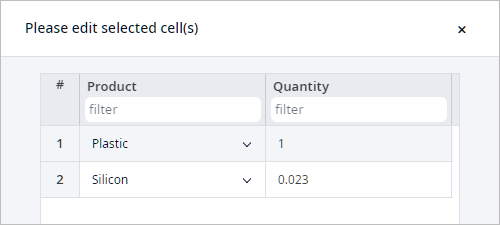
- Click Save to close the dialog box.
We have defined BOM for the production of the food storage containers. Now we will define BOM for the cake molds.
Add bill of materials for cake molds
- Create a new record by clicking Add.
- Name it Cake mold BOM.
- Specify Cake molds as its End Product.
- Set Quantity to 10000 to define the number of cake molds this BOM produces from the components (raw materials) that we will define with the next step.
- Double-click the Components cell to open the dialog box.
- In the dialog box click Add to create a new record.
- Double-click the Product cell and select Silicon from the drop-down list.
- In the Quantity cell type 1. In this way we define that the factory required 1m3 of silicon to produce 10000 cake molds.
- Click Save to close the dialog box.
Now we need to tell the factory that the products should be produced according to the specific bills of materials.
Update production table
- Navigate to the Production table by typing Production in the search field.
- Double-click the BOM cell of the Food storage container product and select Container BOM from the drop-down list.
- In the same way set the Cake mold BOM for the cake molds production policy.
The table should look like this: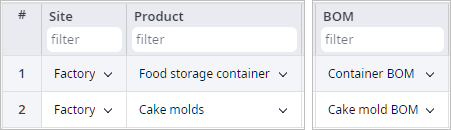
Let us run the experiment.
Run the Simulation experiment and observe results
- In the experiments section click the Simulation experiment tile to open its controls.
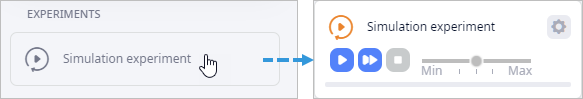
- Click the
 Run in virtual time mode without animation
button to run the experiment at max speed without displaying the map.
Run in virtual time mode without animation
button to run the experiment at max speed without displaying the map.
Now we can analyze the collected data. We are interested in the production of end products based on the BOMs, which define the expenditure of raw materials. As we know, the factory does not store raw materials, so it has to request the raw materials by placing orders. Let us see if any orders were placed.
Analyze the placed orders
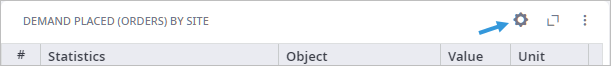
- Click the cogwheel icon icon of the
Demand Placed (Orders) by Site statistics to open the dialog box.
- Open the Object drop-down list and select Factory.
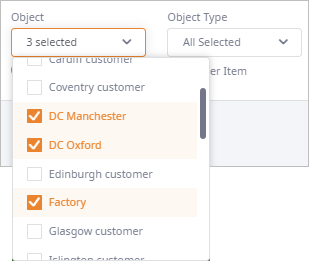
- Click outside the drop-down list to close it.
- Finally, for the Product item click the Per Item toggle button.
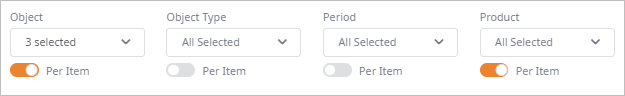
- Click Apply to close the dialog box with settings.
Now we can see the amount of each product ordered by each facility.
As you can see, the factory placed 86 orders for Plastic and 169 orders for Silicon.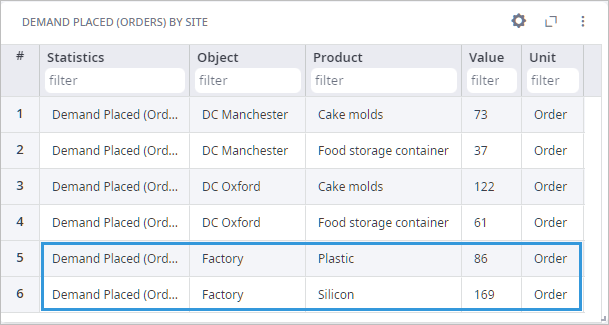
It would be also interesting to observe the factory's available inventory per item. Try defining the settings of the Available Inventory statistics to make it show the required data.
Keep in mind that the factory has Order on demand policies defined for the raw materials, which means that we will not be able to observe the inventory change for these products. According to this policy the inventory is replenished instantly (within the day), while the statistics are updated at the end of the day. Hence the missing data on decrease and replenishment on the chart.
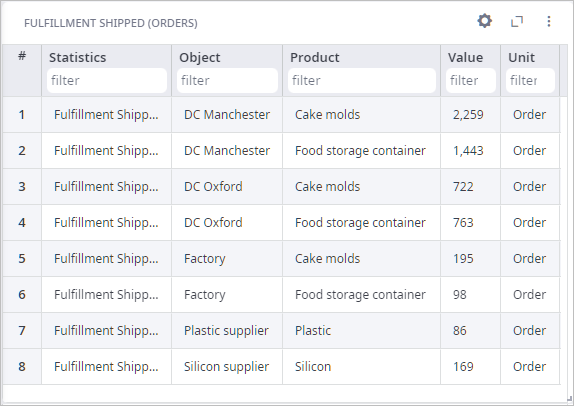
Additionally you may use the Fulfillment Shipped (Orders) statistics to analyze the number of orders the suppliers sent to the factory. Set up statistics to have the following data for analysis.
We have completed the fourth phase of this tutorial. We added bill of material for each product that we offer and ran the experiment.
-
How can we improve this article?
-