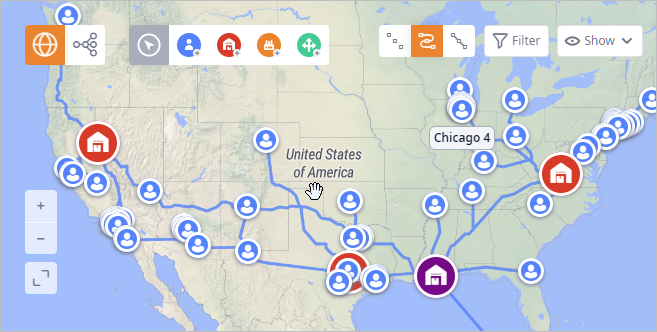
anyLogistix uses GIS (Geographic Information System) data provided by Maptiler.
The GIS map displays the elements of the supply chain scenario and their connections. Once you create a new element (e.g. a customer) or alter an existing connection, the GIS map will be instantly updated.

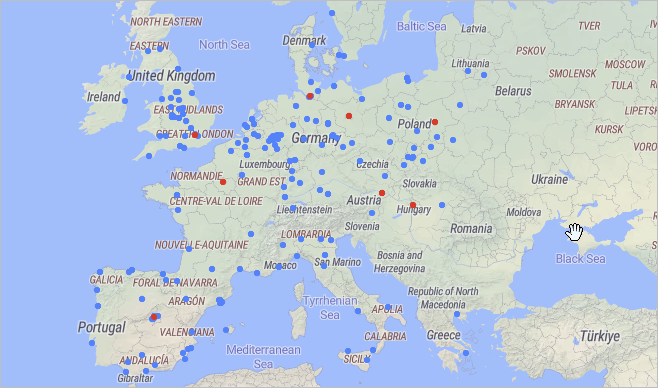
The dust mode is used to visualize elements of the supply chain if there are more than 500 of them in the visible / selected area.
The map is fully functional in this mode

Map view displays and manages the map projection. In geospatial terms, a projection is the translation between a spherical model of the earth to a flat, two-dimensional surface.
A datum is a definition of how coordinates on the sphere are defined. OpenMap projections assume that latitude and longitude coordinates are defined in terms of the WGS 84 datum. OpenMap projections are based on a spherical model of the Earth. Ellipsoidal flattening (eccentricity) is not taken into account.
Tiles displayed by the map are stored in the C:\Users\User\.anyLogistix3\cache folder.
-
How can we improve this article?
-

