In this example, we will learn how to analyze risks in the supply chain caused by incidents, that may happen during the simulation period and that we cannot control. We can simulate this uncertainty by adding special events into the scenario to define the changes caused by these events.
This example is a part of a sequence of scenarios:
- GFA Cold Chain — a scenario for finding warehouse locations using Greenfield Analysis.
- GFA Cold Chain (Multi-Echelon) — a scenario for finding a location of the main distribution center based on warehouse locations.
- SIM Cold Chain (Safety Stock Estimation) — a scenario for adjusting inventory policies to decrease carrying cost and improve Service level.
- SIM Cold Chain (Risk Analysis) — a scenario for testing the supply chain, constructed in previous steps in case of unpredicted events occurring.
All the input data is observed in the first step of this sequence.
In the previous step, we performed a Safety Stock Estimation experiment, which helped us configure inventory policies with the optimized safety stock and improve service level.
All these improvements, however, are not enough to effectively design a supply chain. Supply chain operations are tightly connected to risks and uncertainties, which must be considered while designing supply chain. This complicates the planning process and sets high standards for the agility and robustness of a supply chain. The risks must be estimated to design the network, define policies, and figure out how to act in case of an emergency.
What will happen if an agreement with the supplier terminates, the river Thames floods, or the demand changes? We can add these uncertainties to the scenario using the Events table. To properly define an event, we first need to understand the consequences of this event. For example, if an agreement with the supplier terminates, that means that this supplier becomes excluded from the supply chain (it will not be supplying distribution center anymore). So, we use the Facility state event type to specify the facility to be closed, the event's occurrence time and probability (Random time throughout the year and 10% correspondingly). The same way we defined other events.

If you want to see the effect of stochastic parameters on the supply chain, you should run the Variation experiment. For example, in this scenario, apart from the events, the stochastic parameters are also present in product demand, processing time, and vehicles speed. These parameters randomly change with each run according to the probability distributions we set in the input data. The Variation experiment will run the model multiple times, which will allow us to estimate result distributions and mean result values. In addition to parameter variation, you can also assess particular “what-if” scenarios to stress-test the supply chain in emergency situations by performing a Risk analysis experiment.
Run Variation and Risk Analysis experiments, and analyze results.
It is worth noticing that your results of the Risk analysis experiment will differ from the ones shown here, since randomized seeds are used for every replication of the experiments
The Variation experiment is a multi-iteration experiment. One of its use cases is succession of a number of runs (replications) of a simulation experiment of a scenario with a parameter values defined as probability distributions. Each replication will produce a different result due to these stochastically changing parameters. As a result we receive a mean value.
In the experiment parameters we enable the Use replications parameter, and set Replication per iteration to 10.
We can add all statistics to the dashboard that are available for the Simulation experiment (enabled in the Configure statistics), or leave the predefined statistics.
Run the Variation experiment and analyze the collected statistics.
The Variation results tab shows mean values of every selected statistic. The Revenue, Profit, and Total cost allow us to compare these three parameters for every replication. On the Service Level tab, we can observe the Service Level by Product chart. As we can see, service level is decreasing for most of the replications. And if we look at the Events Table, we will see statistics on events that took place and the exact occurrence time.

There is a huge probability of events’ occurrence, and triggering these events leads to disruptions in the supply chain and its performance.
Now let us run the Risk Analysis experiment to carry out a more in-depth analysis of the consequences the events has on the supply chain. In the settings of the Risk Analysis experiment we can specify the type of the service level it will be based on and the values of Failure and Recovery service levels.
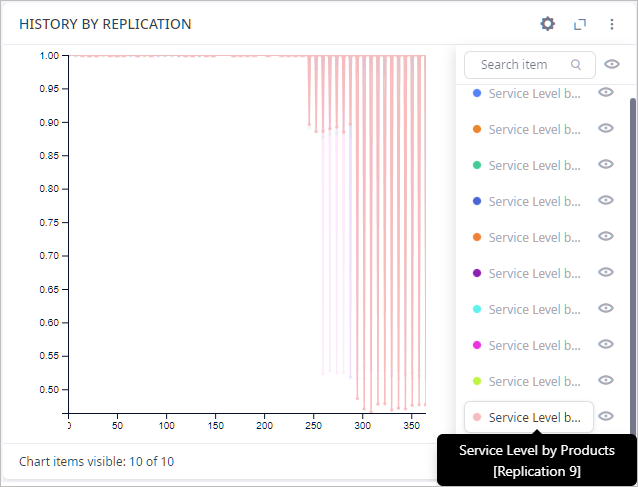
The History by Replication chart from the Target Service Level tab shows the daily service level per replication. As you can see, the replication with the index 9 has the worst daily change of service level. Let’s look at this replication closely.

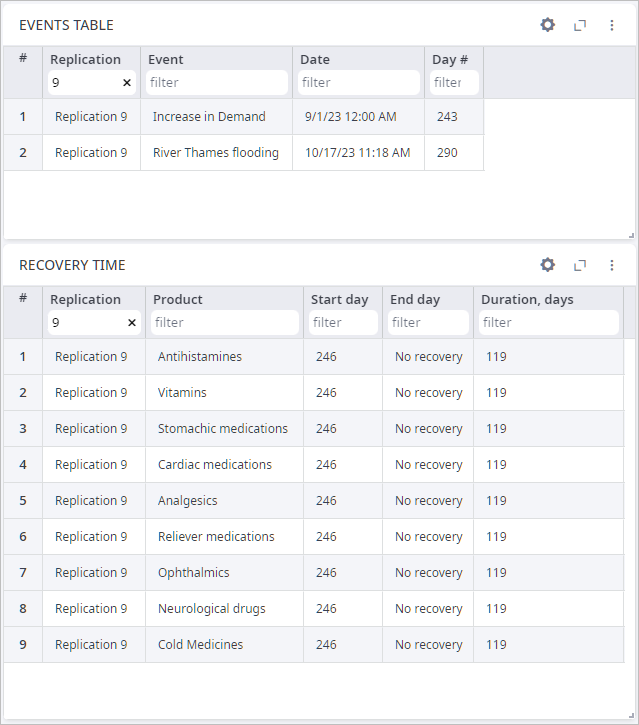
Let us open the Events and Recovery tab. The Events Table shows that two events are taking place in this replication. Since there was only an increase in demand and not a decrease in it afterwards the supply chain was under serious pressure from that time and until the end of the simulation period. And flooding only doubled the problems. Prove to that is Recovery Time table, it shows statistics on the time the supply chain was running below Failure service level. We can see that the service level for all products dropped below the specified value and was not able to recover after that. This means that the company will face difficulties if demand increases and the river Thames floods on the dates shown in the events table.

Based on the results of both experiments runs we can assume that the required service level cannot be maintained by the supply chain in the current state. To increase the supply chain resilience, we may increase expenses for inventory and for preparing additional delivery methods. These changes can then be evaluated by running the what-if simulation experiments
-
How can we improve this article?
-

