This example illustrates a production planning problem: how to maintain customer demand satisfaction in case of temporary increase in demand and fixed production powers. Also, in this example, we will show how to configure the supply chain to optimize the number of facilities used.
For a better understanding of the model, you can watch the demo video of this example.
We will consider a cheese distribution network on the territory of France comprising:
- A cheese plant located in Laval
- Six warehouses are spread over the country
- Three potential distribution centers locations are: Limoges, Orleans, and Auxerre
The cheese plant is supplying groceries with corresponding weekly historic demand
- Find the best distribution centera locations
- Estimate the amount of product the cheese plant should produce each month
The Iterations panel shows the result of the experiment with all the possible combinations sorted per the Profit KPI metric.
The top iteration card is the best one.
So, we can see, that the most profitable location for the distribution center among the considered ones is Orleans.
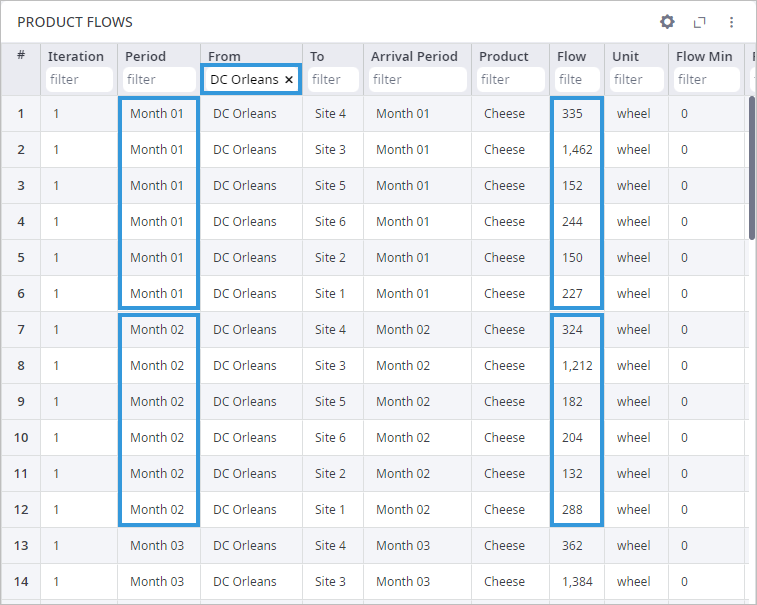
We can aggregate the flow from the distribution center by month to find the total customers demand in each month.

We can create an additional table to estimate the aggregated demand. All the values in the table below are the sums of the flow values from the Product Flow table for the defined month.
| Month | Aggregated demand |
|---|---|
| Month 01 | 2570 |
| Month 02 | 2342 |
| Month 03 | 2646 |
| Month 04 | 2886 |
| Month 05 | 3956 |
| Month 06 | 3350 |
| Month 07 | 4374 |
| Month 08 | 3106 |
| Month 09 | 3570 |
| Month 10 | 3096 |
| Month 11 | 2406 |
| Month 12 | 2518 |
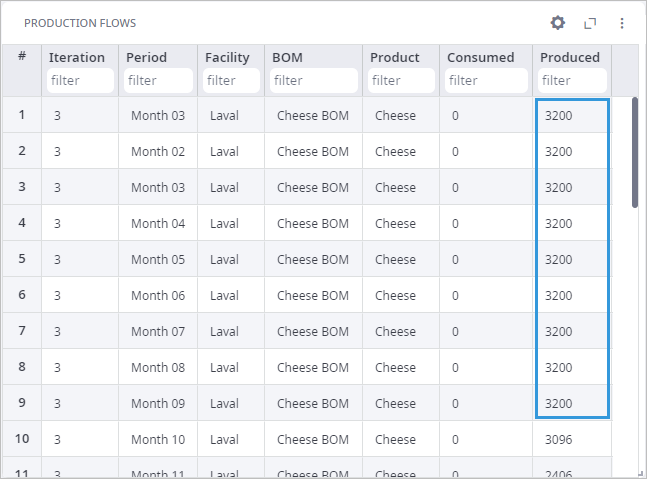
The productive capacity of the factory is insufficient without the initial stock of finished goods to satisfy the demand of the customers within all the periods. The demand has been exceeding the max throughput of the factory during 4 months.
So, to satisfy the demand, the optimizer suggested for the factory to work at full capacity from Month 01 to Month 09 to accumulate additional amount of cheese at the start of the year.

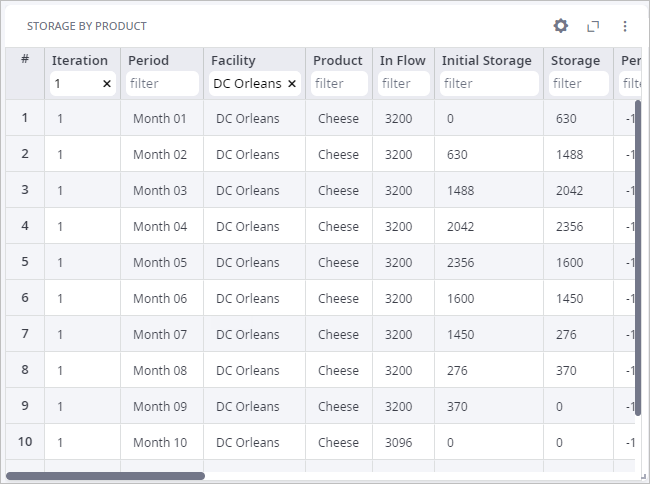
These additional products are stored in DC Orleans and are accumulated until Month 05. After that, the number of the stored products is gradually decreasing to support the lack of the produced products in these months.

That is how master planning can be conducted in anyLogistix.
-
How can we improve this article?
-

