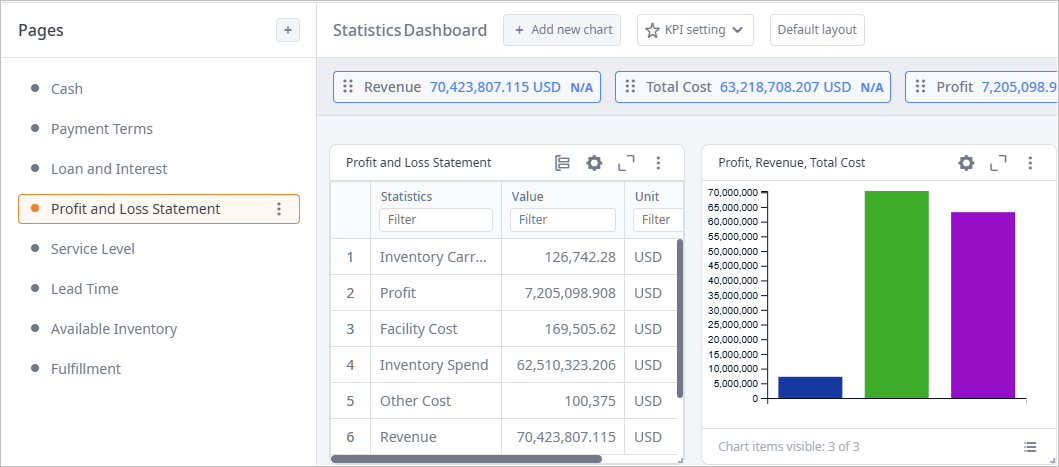
The Statistics Dashboard pane is located in the lower part of the anyLogistix window. It displays the statistics collected during the experiment run:
You can define the frequency at which the charts are updated during the experiment run in the anyLogistix settings.

The pane is divided into two parts:
- The left part displays a list of available dashboard pages.
You can switch between pages, add new pages, reorganize pages by drag-and-dropping-them within the list,
export page data, and remove the existing pages.
This section comprises:
-
Toolbar — contains section's name and the
 Add page control, allowing you to
add new pages.
- List of pages —contains user-defined pages with dashboard elements visualizing statistics.
-
Toolbar — contains section's name and the
-
The right part contains dashboard elements for the currently selected page.
This section comprises:
-
Toolbar — contains the name of the result and the following set of controls:
- The name of the result, containing the gathered data.
-
 Add new chart — opens the chart settings dialog box, allowing
you to add a new dashboard element.
-
 KPI setting — opens the drop-down list with
KPI settings.
- Default layout — resets the user-defined layout of the charts added to the dashboard.
- KPI ribbon — [available if Show KPI values in dashboard is enabled in KPI settings] the list of defined KPIs.
- The dashboard with the user-added dashboard elements visualizing the collected data.
-
Toolbar — contains the name of the result and the following set of controls:
Follow this scenario to learn how to work with the Statistics Dashboard pane:
- Before running the Simulation experiment, choose the statistics that will be collected during the experiment execution:
-
Click the
 Statistics Configuration
button in the Simulation experiment view.
The Statistics Configuration section will open.
- Choose the desired statistics by enabling the toggle buttons next to them. Note that you can specify the statistics to be collected only before the experiment is run. When the experiment starts, the chosen set of statistics is populated with the experiment data.
-
Click the
- Configure the Statistics Dashboard by adding or removing pages and dashboard elements.
- Run the experiment. During the experiment run the collected statistics will be visualized on the Statistics Dashboard pane. After the experiment run, you can find its statistics under the corresponding node in the Experiments tree.
-
How can we improve this article?
-

