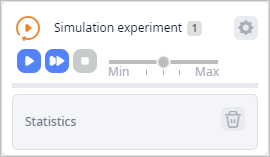
Based on the data provided in the scenario tables, the Simulation results contain detailed statistics on expenses, revenue, inventory dynamics, service levels, bullwhip effect, incoming / outgoing orders, etc.
The results can be compared and exported to MS Excel file. The export can be done per page only. If required, you can rename and remove a page.
To see experiment results
- Run the experiment.
- Once the experiment is completed, a new Statistics item will be created below the
Simulation experiment tile.

- Click Statistics to observe the result, if you have previously navigated away from it.
-
How can we improve this article?
-

