In the previous phase we imported the scenario and observed the service level in the statistics gathered by the Simulation experiment. In this phase we will:
- Run the safety stock estimation experiment
- Analyze the results
- Export the result with the offered safety stock to a new SIM scenario
- Check the service level with the offered safety stock
Run the Safety stock estimation experiment
- In the experiments section click the Safety stock estimation tile to open the experiment controls.

- In the expanded tile click the
 Show settings icon to open the experiment's
settings.
We are interested in the following parameters:
- Replications per iteration — replications are used to improve representability of the experiment run, since demand is set to a probability distribution. Note that completing the experiment with replications takes a bit more time.
- Desired service level, % — we will assume that 98% is the service level that we would like to reach.
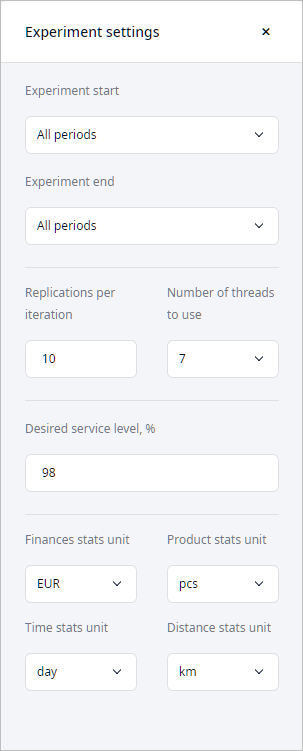
- Leave the default experiment settings and run the experiment by clicking
 Run. Experiment execution will take some time.
- Observe the final results. When the experiment is completed, you will be taken to the Result tab containing the results.
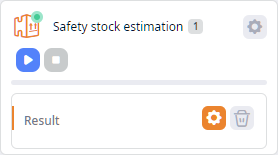
Let us analyze the received data.
Analyze the received results
- Navigate to the Safety Stock Estimation page in the Result dashboard below.
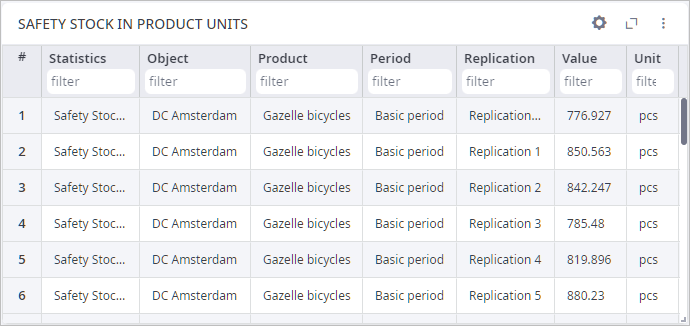
The page contains the Safety Stock in Product Units table, which shows the amount of products (per distribution center and per replication) that must be kept as safety stock.
Your data may differ, since demand is defined via the uniform distribution and the random number generator uses a random seed for each experiment run.
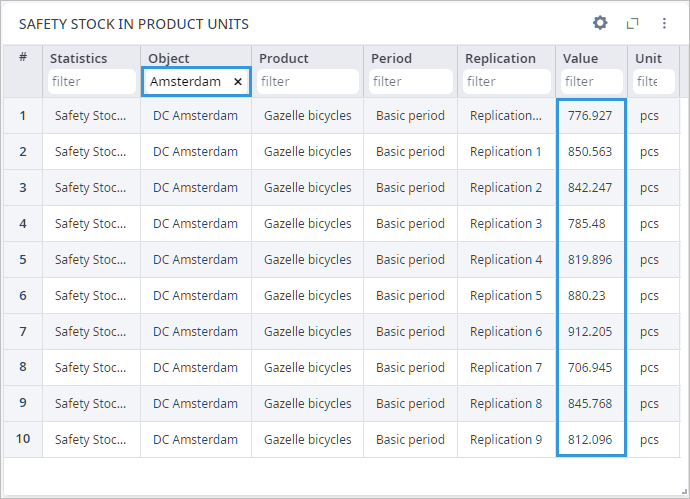
- Filter the data by typing Amsterdam in the filter field below the
Object column name. This will allow us to see the offered safety stock amount per replication for this distribution center.
The actual safety stock is calculated as mean value, i.e., by adding the received safety stock amounts from each replication and dividing the resulting value by the number of replications (828.748 bicycles in case of Amsterdam).
- Navigate to the DC Amsterdam page below the Safety Stock Estimation page.
It contains a histogram, showing how often a certain amount of safety stock is required.
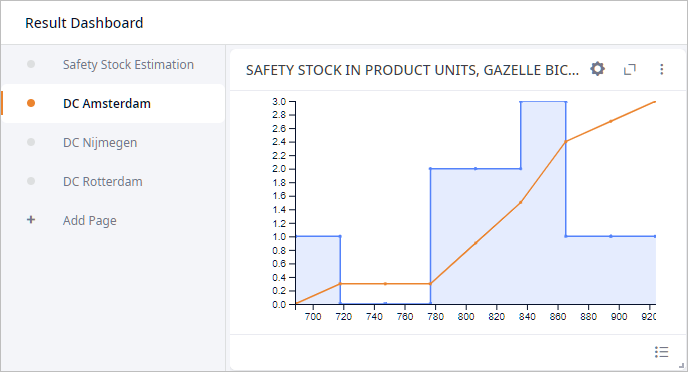
- In the same way observe the offered data for DC Nijmegen and DC Rotterdam.
The received result can be converted to a new scenario that will be a complete copy of the existing scenario plus the adjusted inventory policies.
Convert result to a scenario
- Right-click Result below the Safety stock estimation tile.
A pop-up menu will open.
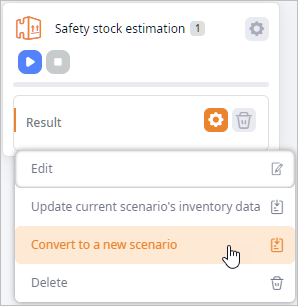
- Click Convert to a new scenario.
A new scenario will be created. You will be instantly taken to it.
Supply chain of the new scenario must perform better, since it contains updated inventory policies. Let us observe the new policies and run the Simulation experiment.
Observe inventory policies
- Navigate to the Inventory table of the new scenario.
As you can see it now contains 6 records. Let us take a closer look at the changes:
- The old policies are grayed out.
- The new policies are of new type. Distribution centers are now using Min-max policy with safety stock to replenish their inventories.
- The offered safety stock amount is added to the new policies. You can see it in the Policy Parameters column.
- The initial stock has increased.

We have observed the updated data of the scenario, and we may now run the Simulation experiment to see if the changes have improved the service level.
Run the Simulation experiment and observe the result
- Click the Simulation experiment and click the toolbar
 Run in virtual time mode without animation button.
The experiment will be completed within a few seconds. - Now examine the gathered statistics. We can see that the amount of lost orders has decreased and the service
level has increased.
Let us change the data visualization type for the Service Level by Orders element to have a better understanding of the service level that we have reached.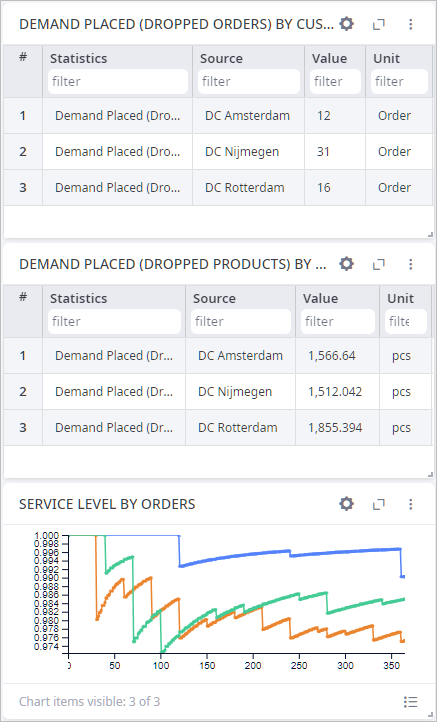
- Click the
 cogwheel icon in the top-right corner of the
Service Level by Orders element to open its settings.

-
Now set Table as the chart type for this statistic.

-
Click Apply to close the dialog box and observe the service level.
As you can see, the lowest service level is 0.98. That is exactly what we've aimed for.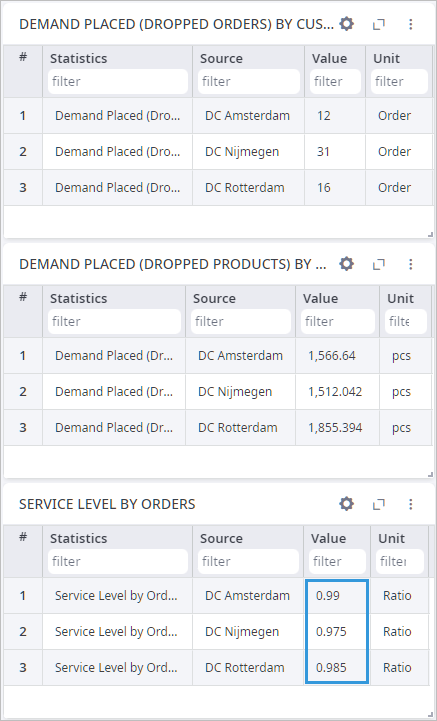
In the same way you may estimate the safety stock amount for the Desired service level of 100%.
With the last step we have successfully completed the Safety stock estimation experiment tutorial.
-
How can we improve this article?
-

