

In this example you will learn how to set capacity-cost dependencies using Custom Constraints, Linear Ranges, and Indicator Constraints, as well as how to modify the objective function in optimization. These constraints will be considered by CPLEX to provide the best solution for choosing the optimal distribution center sizes to open.
We consider a supply chain on the territory of the USA comprising:
- distribution center in Topeka
- 100 customers
The demand for lamps is proportional to the population of the cities.
The network model may consider 3 distribution centers with different sizes:
- 1200 sq m (600000 lamps)
- 1800 sq m (900000 lamps)
- 2400 sq m (1200000 lamps)
Each distribution center has fixed investment, carrying, maintenance and throughput costs:
- Fixed investment costs depend on the distribution center size:
- IF DC capacity is 600 000, then the fixed investment costs constitute $1 000 000
- IF DC capacity is 900 000 then the fixed investment costs constitute $1 500 000
- IF DC capacity is 1 200 000 then the fixed investment costs constitute $2 000 000
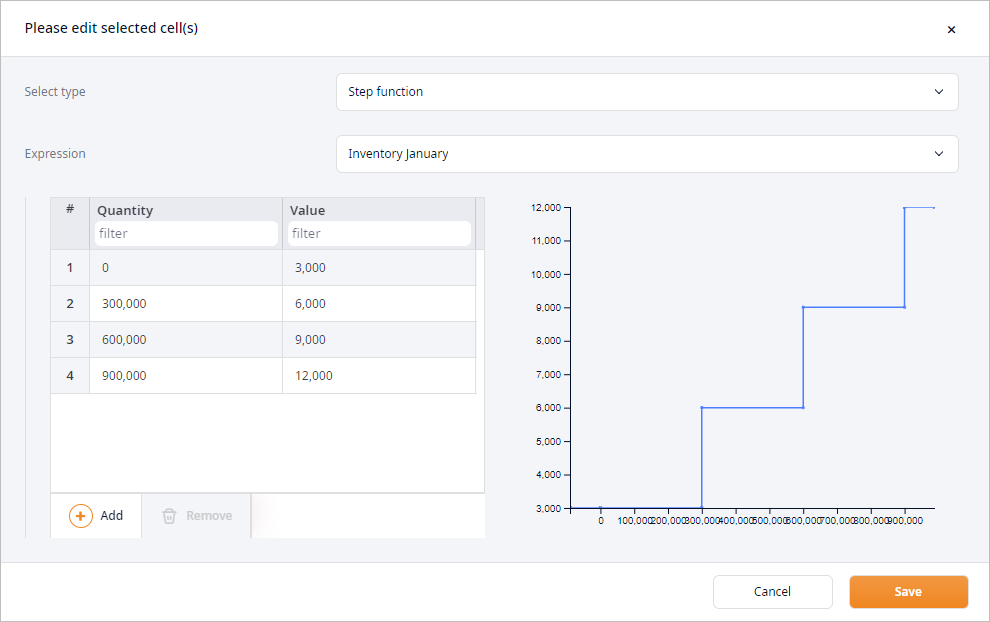
- The carrying cost function is “stepped” and depends on the inventory:
- IF 0 < DC inventory < 300 000 pcs, then the carrying costs constitute $ 3 000 per month
- IF 300 000 < inventory < 600 000 pcs, then the carrying costs constitute $ 6 000 per month
- IF 600 000 < inventory < 900 000 pcs, then the carrying costs constitute $ 9 000 per month
- IF 900 000 < inventory < 1 200 000 pcs, then the carrying costs constitute $ 12 000 per month
- Warehouse maintenance costs depend on distribution center size:
- IF DC capacity is 600 000, then the maintenance costs constitute $ 72 000 per year
- IF DC capacity is 900 000, then the maintenance costs constitute $ 108 000 per year
- IF DC capacity is 1 200 000, then the maintenance costs constitute $ 144 000 per year
Note how constraints are defined.
Select the most suitable distribution center size to invest in.
The result of the experiment contains warehouse of 1 200 sq m that suits us.
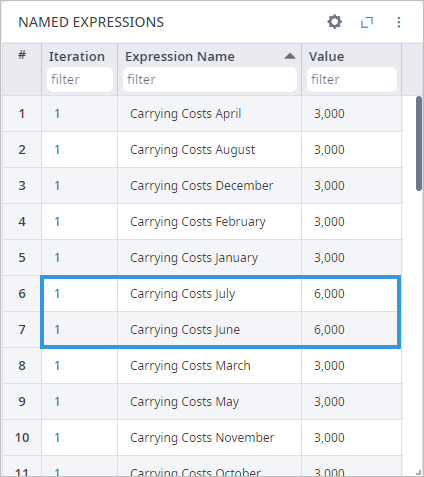
The Named Expressions page shows the detailed statistics on the user-defined constraints within the supply chain.
As you can see on the screenshot below, the Carrying Costs peak at 6 000 in June.
The Iterations panel shows the result of the experiment with all the possible combinations sorted per the Profit KPI metric.
The top iteration card is the best one.
The data on other details is shown in the corresponding tables:
First, we need to assign special labels to the Product Storage for every period defined in this scenario. These labels will be used further in defining the constraints.
The following tables allow to define constraints:
Let us see how we can define custom constraints in the current task:
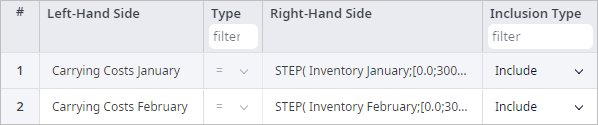
- In the Custom Constraints table we define functions and variables:
- Left-Hand Side — in our case contains the name assigned to the function that is defined in the Right-Hand Side.
- Right-Hand Side — defines the function and its type.
- Below you can see the defined functions:
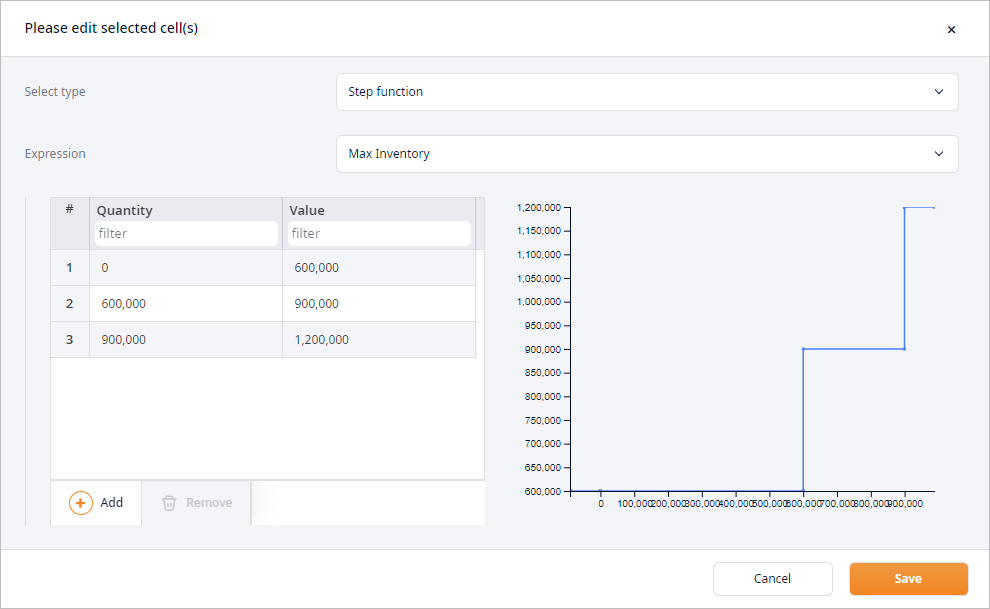
- The carrying cost expressions defined as a Step function:
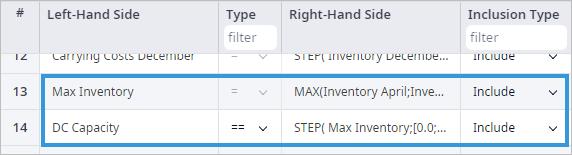
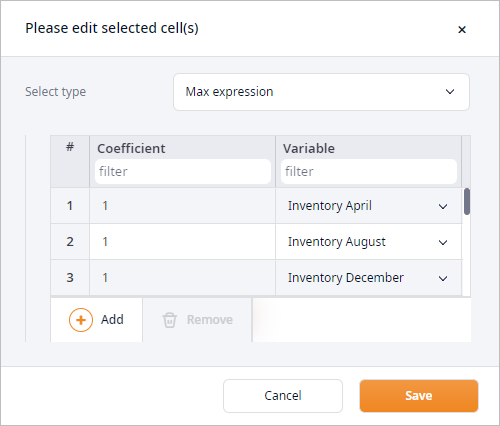
- Max Inventory expression defined as maximum of all inventory values:
-
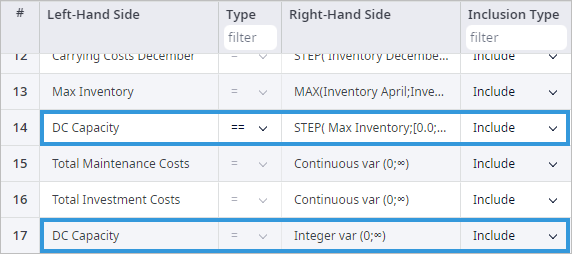
The distribution center's capacity is a variable of the integer type that is defined as Step function
that depends on the previously defined Max inventory expression.
DC capacity variable should be set to Integer to avoid issues with CPLEX integrality tolerance.
- Also, we declare two new costs as Continuous variables, which can have only non-negative value.
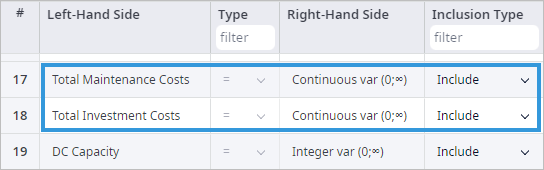
These costs will be calculated based on the DC Capacity variable defined in the previous step, and in accordance with the Constraints section. To define these constraints, we are using the Step function one more time
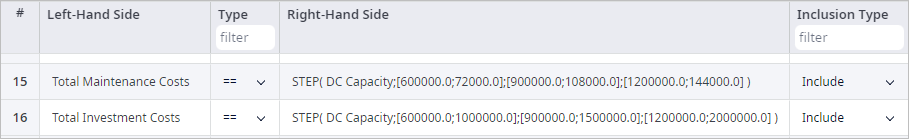
There is also another way to define the Total Maintenance Costs and Total Investment Costs by using the Linear Ranges and Indicator Constraints tables. We can simply define the if-then statement for each of the costs and each of the DC capacity values.
- The carrying cost expressions defined as a Step function:
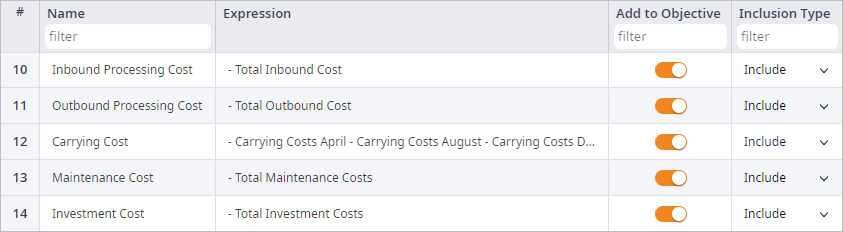
- Finally, we have set up everything to expand the objective function (Carrying Cost)
and to add two new costs declared in Custom Constraints table in the Objective Members table.
These costs will now be subtracted from the Revenue objective function, which will impact the optimization results.
-
How can we improve this article?
-