The table visualization method allows you to group table records by the values of the table's one or several columns. When the Group data checkbox is selected, the table records become grouped by each of this column's values.
Data aggregation and grouping features are available only in the grouping mode. On leaving the grouping mode the defined aggregation and grouping setup is saved. This setup will be restored the next time you enter the grouping mode. You may reset the defined data grouping, if required.
To group table records by column values
-
Click the
 Group data icon to enter the grouping mode.
The table header will acquire a new line with grouping checkboxes and aggregate functions drop-downs (depending on the value type of column).

-
Select the checkbox of the column, by which you wish to group table records.
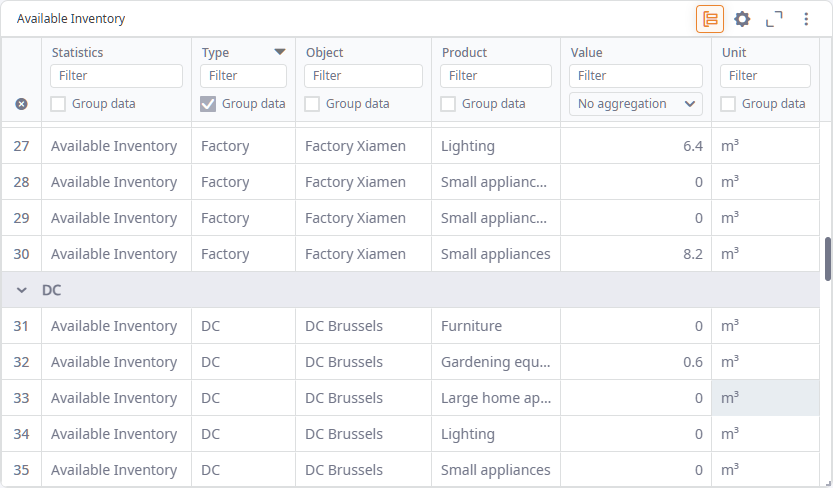
Table records will be grouped by this value:
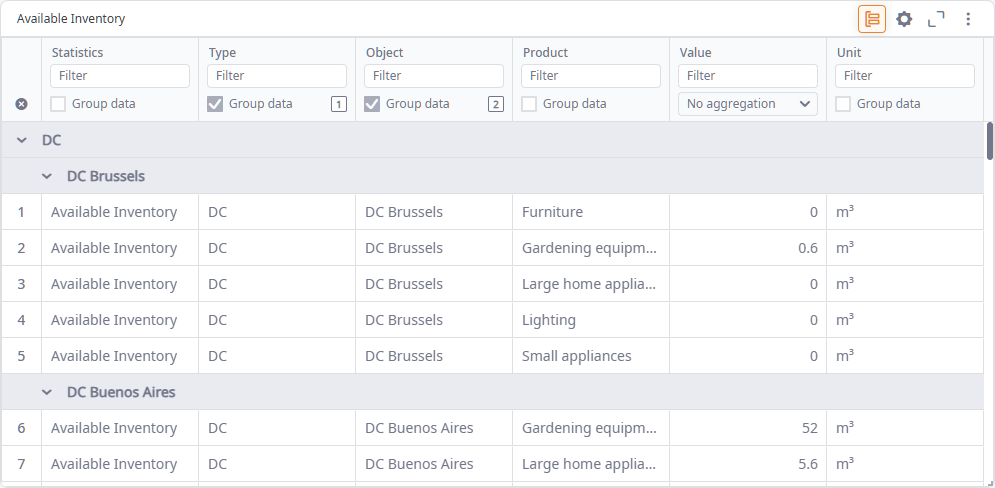
You can group a table by several columns if necessary. In this case, the order, in which the table data is grouped, will be defined by the ordinal number next to each selected checkbox:
The order can be changed.
-
Optionally, set an aggregate function for the desired columns.
To change the grouping order
- Click the ordinal number next to the selected Group data checkbox.
-
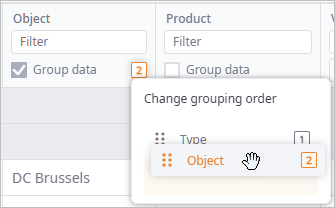
In the opened drop-down list click and drag the required item to reorder data grouping.
-
Release the mouse button on the required position.
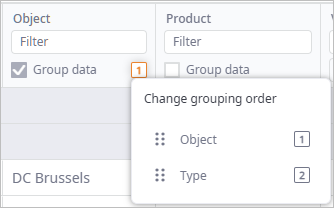
The ordinal numbers will be updated to reflect the new grouping order.
To ungroup table records by column values
- Deselect the checkboxes of the columns that must not group data. When done, table grouping will be updated.
To expand / collapse groups
-
Right-click the collapsible grouping line to open the drop-down menu.
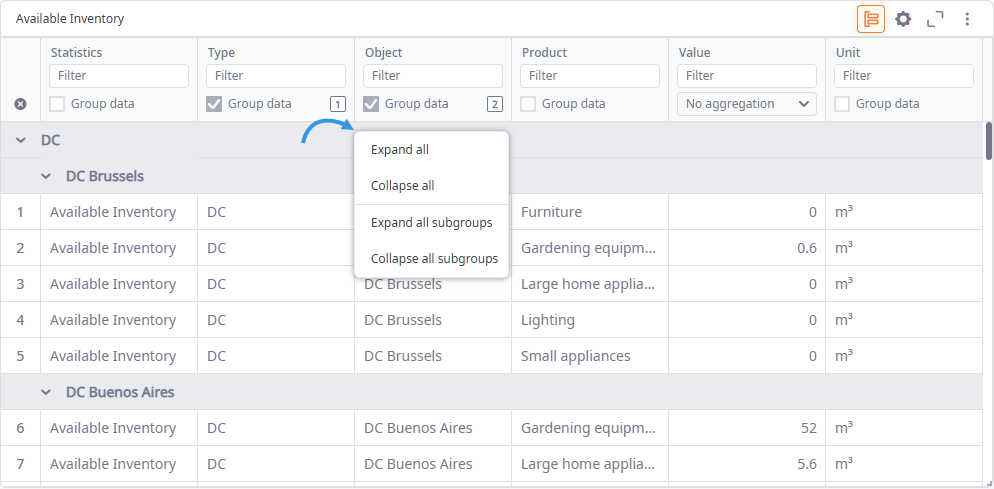
- Select the required action to expand / collapse all groups / subproups.
To reset aggregation and grouping
-
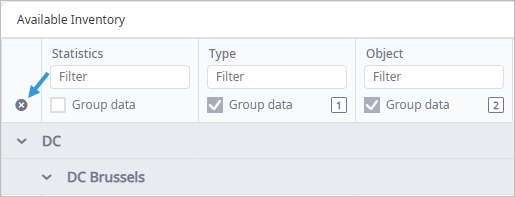
To reset all the defined aggregation and grouping click the
 Reset icon.
-
How can we improve this article?
-

