

Results of the Comparison experiment allow you to analyze the effect of the different initial conditions on the outcome.
To see experiment results
- Run the experiment.
-
Once the experiment is completed, a new Result item will be created below the
Comparison experiment experiment tile.
- Click Result, to analyze the results, if you have previously navigated away from it.
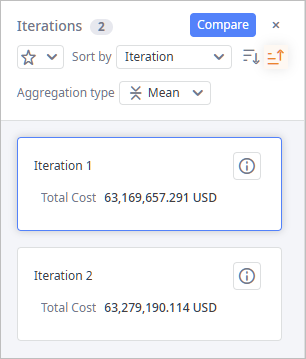
The results of the Comparison experiment run are displayed in the Iterations panel.
All the details are available on the dashboard's Comparison results page below the experiment's view in the form of a table. If required, you can rename, remove a page, or export the content of the page's statistics to an MS Excel file.
Each table record corresponds to the experiment iteration, i.e., to a single included scenario:
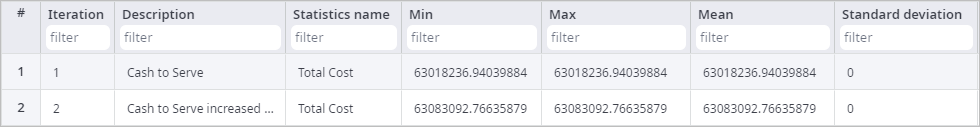
The table contains the following columns:
- Iteration — the ordinal number of iteration.
- Description — the name of the experiment iteration.
- Statistics name — the name of the statistics.
-
The set of columns for each collected statistics:
- Min — calculated minimum value of the collected statistics' values.
- Max — calculated maximum value of the collected statistics' values.
- Mean — calculated arithmetic average of the collected statistics' values.
- Standard deviation — calculated standard deviation of the collected statistics' values.
The Iterations panel contains iterations of the selected result. The basic data of each iteration is shown on an iteration card.
To hide / show the Iterations panel
-
Click the
 Iterations control on the currently selected output item to toggle the panel's visibility.
The panel contains:
- Controls — use controls to manage iteration cards.
- Iteration cards — one card per iteration a result contains. Cards contain a set of KPI metrics to instantly observe the efficiency of the supply chain within a specific result iteration.
Iteration controls
The header of the Iterations panel comprises:
- Iterations — the title of the panel with the number of iterations this result contains.
-
 — [available only in the anyLogistix Professional and anyLogistix Professional Server editions]
opens the Iterations Comparison dialog box, which allows you to compare iterations of this result.
— [available only in the anyLogistix Professional and anyLogistix Professional Server editions]
opens the Iterations Comparison dialog box, which allows you to compare iterations of this result.
-
 — closes the Iterations panel (you can open it later).
-
 — opens the drop-down list of KPI metrics that can be added to the iteration cards.
The drop-down list contains statistics that are enabled in the Statistics Configuration dashboard.
— opens the drop-down list of KPI metrics that can be added to the iteration cards.
The drop-down list contains statistics that are enabled in the Statistics Configuration dashboard.
-
Sort by — the sorting type of iteration cards.
By default the cards are sorted by the iteration name (it contains the ordinal number).
The statistics, by which the sorting is done, is highlighted within the card and is placed at the top.
-
 — select to reorder the sorted cards in the descending order.
-
 — [selected by default] reorders the sorted cards in the ascending order.
-
Aggregation type — the filter of value types to show in iteration cards:
- Max — calculated maximum value of the collected statistics' values.
- Mean — [selected by default] calculated arithmetic average of the collected statistics' values.
- Min — calculated minimum value of the collected statistics' values.
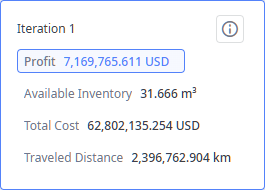
Iteration cards
Iteration cards contain a set of KPI metrics to instantly observe the efficiency of the supply chain within a specific result iteration. The content of iteration cards is user-defined.
The iteration card comprises:
- Title — iteration name with its ordinal number.
-
 — shows the name of the scenario, which was used in this iteration of experiment run.
- The list of user-defined KPI metrics.
-
How can we improve this article?
-