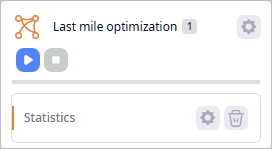
Results of the experiment contain a set of milk runs with the shortest travel times. The set includes only the milk runs that let a vehicle visit every customer serviced by a corresponding site by each specified vehicle type. So the generated milk runs offer:
- Properly configured delivery network.
- Optimized travel time (per generated milk run).
The saved results can be:
The results are available in the dashboard below the experiment's view in the form of statistics, distributed through the pages on the left (each tab refers to a certain type of statistics). The first two pages are preset and contain custom statistics. These pages cannot be edited or deleted, their content cannot be modified (grouping / aggregating data is not available), but the received data can be converted to the current or new scenario:
- Milk Runs — shows the milk runs that were generated by the experiment.
- Shipments table — shows detailed statistics on all the generated shipments.
The other pages, if required, can be renamed, removed, or exported to an MS Excel file. The content of these pages can be changed as well.
To see experiment results
- Run the experiment.
-
Once the experiment is completed, a new Statistics item will be created below the Last mile optimization tile.

- Click Statistics to observe the result, if you have previously navigated away from it.
- Select the Milk Runs page. It contains a table with generated milk runs, one per table record.
-
Enable the toggle button next in the required record to have the milk run it contains displayed on the map.
Only one milk run can be displayed at a time. All other objects and their connections are grayed out / disabled.
- Explore other pages, create new ones and add the required statistics to analyze the result.
-
How can we improve this article?
-

