

Before running the Cost to serve experiment make sure it complies with the requirements of the Network optimization experiment.
The Cost to serve experiment uses the data of the optimized scenario, which is the result of the Network optimization experiment. If there is no optimized scenario to work with, the Cost to serve experiment will run the Network optimization experiment to obtain the result. This result will then be used to estimate the transportation costs.
To run the Cost to serve experiment
-
Click the required scenario of the
 type in the anyLogistix
scenarios ribbon.
type in the anyLogistix
scenarios ribbon.
- Navigate to the experiments section and select Cost to serve.
If the Experiment settings panel is not open, click
 in the experiments controls.
 - Set the experiment settings:
-
Specify the desired Solution strategy.
In case of Cost to serve calculation only option the Network optimization experiment must have at least one result, since you will be asked to select it from the Result drop-down list of the Cost to serve experiment's parameters. The measurements units will also be taken from the selected result.
- Define the Experiment duration period that must be processed.
-
In case of the Optimization + Cost to serve solution strategy the following settings might also require attention:
- Specify the required Demand variation type.
- Define the objective by selecting the required option in the Select search type for N best solutions.
- Now specify the number of solutions that you need to find in the Number of best solutions to find.
- Set the time limit in the Optimization time limit,sec parameter.
- If needed, specify the Relative MIP gap.
-
Specify the desired Solution strategy.
- Click
 Run to execute the experiment.
The log view will appear with a progress bar showing the progress of downloading the required routes.
The experiment will be executed once all the routes have been downloaded.
The log view will now show the progress of the experiment.
Run to execute the experiment.
The log view will appear with a progress bar showing the progress of downloading the required routes.
The experiment will be executed once all the routes have been downloaded.
The log view will now show the progress of the experiment.
- Analyze the results of the experiment provided.
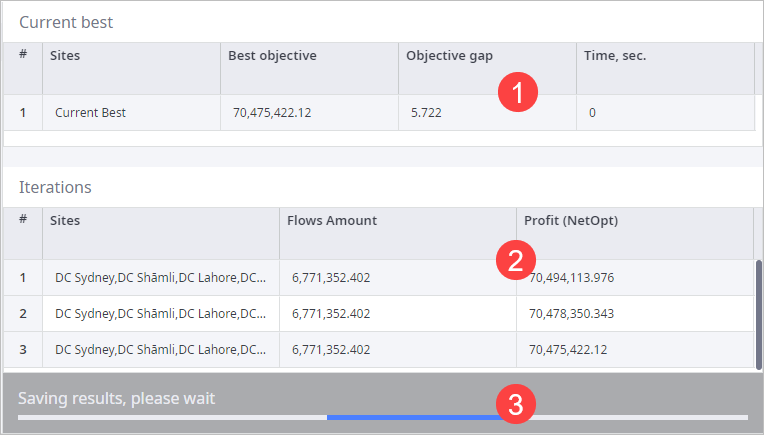
The optimizer log view is available only during the experiment run. It shows the current progress of the experiment:
- Current best — the best current solution. If a better solution is found, it will substitute the current table record.
- Iterations — all the solutions that the experiment finds as it progresses.
- Running the experiment — the progress bar showing the current progress of the experiment.
-
How can we improve this article?
-