

In this example we will apply the cost to serve analysis (the Cost to serve experiment) to identify hidden profitability issues within the supply chain. While traditional accounting may show a healthy gross margin, the cost to serve analysis allocates all costs from logistics, service, and operations directly to customers. This model provides actionable insights for strategic decision-making by revealing the profitable customers and those who are minimizing the company's profit.
Apex Auto Parts GmbH is a regional automotive parts distributor based in Munich, Germany. The company supplies five product types (spark plugs, oil filters, shock absorbers, and brake rotors) to 24 independent auto repair shops and major clients across Southern Germany (Bavaria, Baden-Württemberg, Hesse, and Saxony).
Despite the steady revenue growth, the company’s net profit growth has slowed significantly within recent months. The company management believes that satisfying demand of certain customers consumes a disproportionate amount of resources. However, substantiating this suspicion or taking corrective actions is impossible without the in-depth analysis, which currently lacks data.
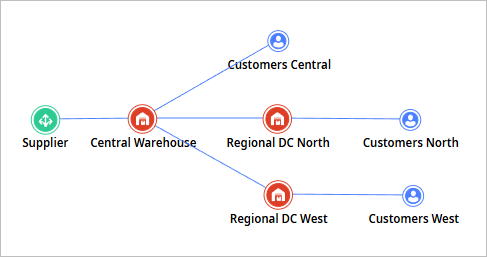
The current supply chain configuration comprises:
- Supplier — a wholesale parts supplier located in Bergamo, Italy.
-
Distribution Network:
- Central Warehouse — supplies the regional distribution centers and nearby customers. It is located in the suburbs of Munich.
- Regional Distribution Centers, which are located in Stuttgart and Nuremberg.
- Customers — 24 customers located in cities from Garmisch-Partenkirchen to Leipzig.
- Demand data — a detailed 4-week demand plan for all customers and products, including variable weekly order patterns.
The primary goal of this analysis is to move beyond aggregated financial metrics and identify customers or products generating negative net profit, accounting for the full cost to serve.
To begin, we will conduct a Network optimization experiment to evaluate the current state of the supply chain.

As we can see from the KPI metrics in the Network optimization experiment results, the company’s operations are profitable.
The net profit margin is 9.5%, which represents the average level of profitability. This level ensures stable operations but is already insufficient for sustained future business growth.
The next step is to examine the cost of serving each customer. This information is not available in the baseline experiment results. The obtained data needs to be processed to get the picture. Also, it is much more convenient to view the resulting costs through the results of a Cost to serve experiment. Therefore, we will run the Cost to serve experiment for the same scenario.
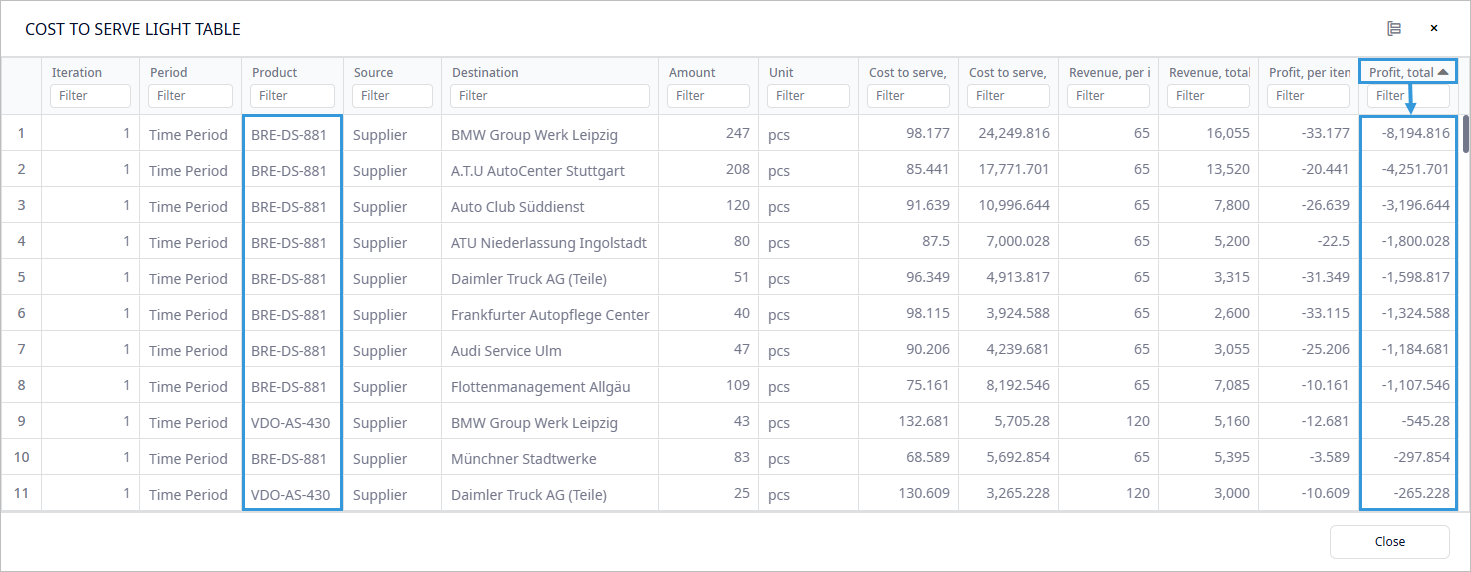
Let’s examine the Cost to Serve Light Table in the experiment's results dashboard. This table contains aggregated values of the key indicators collected as a result of the Cost to serve calculation. Each row in this table corresponds to a specific customer-product combination. If we sort the table data by the ascending Profit, total values, we will see that delivery of a significant number of products (most of which are BRE-DS-881 products) generates negative profit.
Now, let’s examine the Cost to Serve by Product table. The data in this table comprises the data from the previous table aggregated per product. As can be seen, the delivery of BRE-DS-881 product does really generate losses for the company. The gap between the Cost to Serve, per item and Revenue, per item is nearly €20.
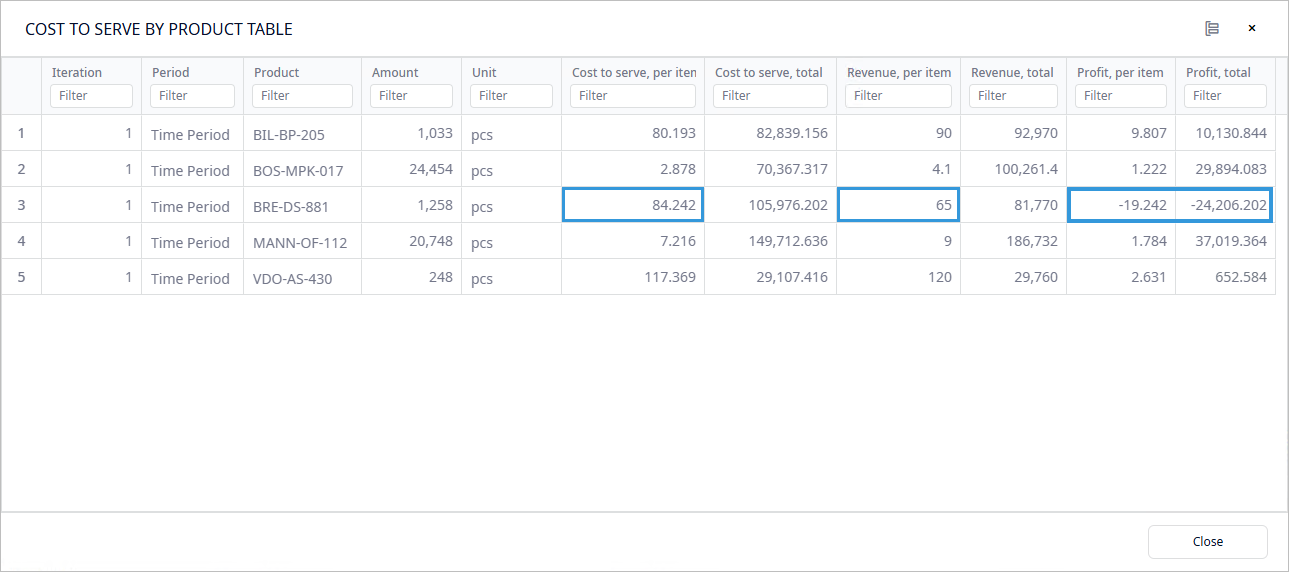
The product VDO-AS-430 is also worth noting, since it can also be found in the sorted Cost to Serve Light Table generating a loss. Although the total profit across all customers for this item remains positive, there is a dip in profit as compared to the other three profitable products.
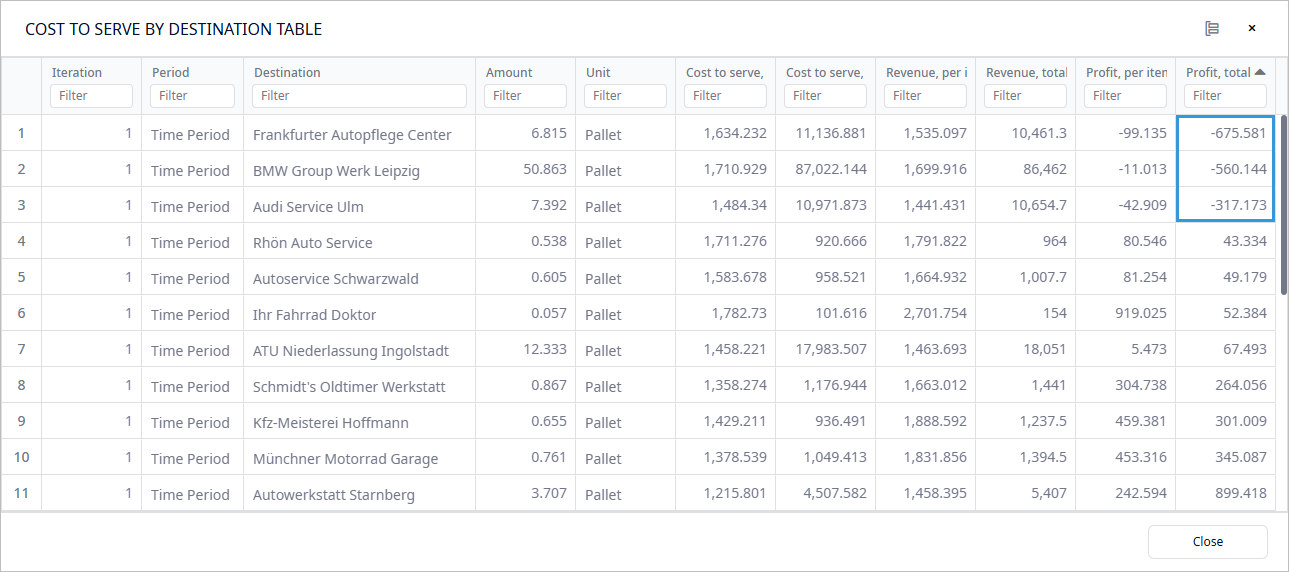
We can also examine the Cost to Serve by Destination table. Similar to the previous table, this one provides aggregated data, but this time grouped by the customer. By sorting the table in the ascending order by Profit, total, we can see that 3 out of 24 customers are unprofitable for the company. However, if we compare the total loss across all customers (€1,552.9) with the total loss generated by the BRE-DS-881 product alone (€24,206.2), we can conclude that the company's primary problem is the specific product rather than the customers.
The management's assumption that the supply chain is inefficient proved to be correct. However, the analysis of the calculations shows, that the company's main problem is one of the products, and not the customers it is shipped to. The focus should be on solving this problem first. The Cost to serve experiment can then be run again to identify further areas requiring attention.
Apart from this, the problem with the BRE-DS-881 product can have several solutions, which can be tested by running the Cost to serve experiment. For example:
-
How would a price change affect the supply chain if:
- The product's selling price was increased?
- The product's cost (supplier's product price) was decreased?
- Would it be better to stop selling this product and focus on selling profitable products or adding new ones?
This cost to serve analysis provides Apex Auto Parts GmbH with a powerful, data-driven tool for customer evaluation. The model successfully shifts the focus from revenue to customer profitability, demonstrating that not all revenue is "good" revenue. By knowing precise allocation of logistics and service costs, the company can define the weak point generating losses and make informed strategic decisions to improve overall supply chain efficiency. The final result is not just a report, but a dynamic tool for evaluating trade-offs and guiding the company towards a path of more profitable and sustainable growth.
-
How can we improve this article?
-