

The Last mile optimization results offer optimized milk runs comprising numerous customers that are visited in a certain order. Hence, the necessity to have this sequence visualized on the map to have a better and instant understanding of the milk run structure.
To examine results
- Once the experiment is completed, a new Statistics item will be created below the Last mile optimization tile.
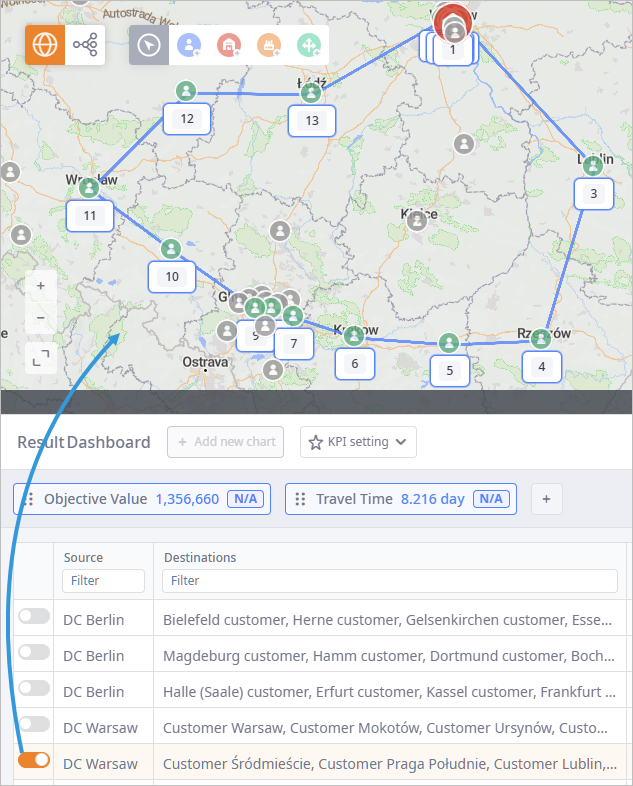
- Click the Milk Runs page in the dashboard. This page contains the Milk Runs table with all the generated milk runs (one per table record).
-
Click the toggle-button of the required milk run to have it displayed on the map.
The visited customers are marked with numbers corresponding to the order in which each customer is visited:
-
Click
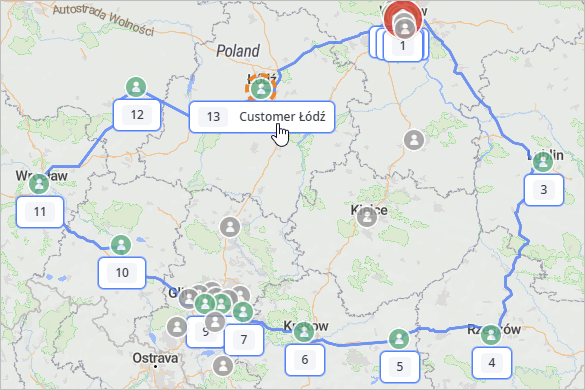
 Show connections to have the connections displayed as actual roads (by default
 Show straight connections is selected).
-
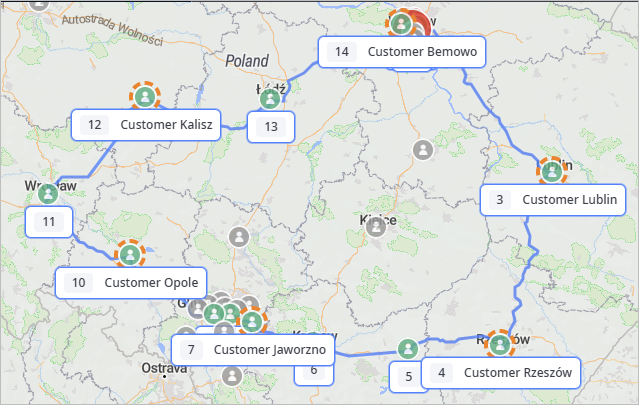
Hover your mouse over the required object's description box to expand it. The box contains:
- The ordinal number of the selected object.
- Name of the selected object.
-
Click the description box to pin it and select the customer.
You can pin multiple description boxes by pressing Ctrl and clicking (macOS: Cmd + click) the required objects.
The result of the experiment may offer numerous milk runs.
To reduce the number of milk runs displayed on the map, use the  Filter parameters:
- Reset all — removes all the defined filters.
-
Suppliers — filters suppliers, leaving only the selected elements on the GIS map.
The suppliers are not considered by the experiment, that is why they are by default grayed out and have no connections. - Sites — filters sites (distribution centers, factories), leaving only the selected elements on the GIS map. The milk runs of the selected site(s) will remain on the map, while all the other milk runs will not be displayed (even if such milk run is enabled in the Milk Runs table).
- Customers — filters customers, leaving only the selected elements on the GIS map. All milk runs will remain displayed on the map regardless of the applied filter. The unselected customers are removed from the map, but the milk run connections remain as if the customer is there.
- Products — filters milk runs, leaving only the milk runs delivering the selected products. If a product is delivered only within several segments of the milk run, the milk run will still be fully displayed on the map.
- Periods — this filter is not applicable to the results of the Last mile optimization experiment.
- Vehicle types — filters milk runs, leaving only the milk runs that use the selected vehicles.
-
How can we improve this article?
-