

In the previous phase we created API requests, and successfully run the application. In this phase we will:
- Change duration of the simulation period.
- Export the received result to an MS Excel file.
To continue, we will need to update our .java class file with the following (fetch the updated ApiTutorialPhase3.java file and add it to your Gradle project):
- The list of classes to import.
- New API requests to complete this phase.
- The new getCustomEndTypeProperty() method added at the end of the file. It will be used to return the required experiment parameter.
Let us start with modifying the file you downloaded.
Provide your connection settings:
- Open the ApiTutorialPhase3.java class file.
-
Provide your data in the corresponding constants:
- anyLogistix Professional Server address.
- Your API key.
- The name of the anyLogistix project.
- The name of the importing file, and path to it.
-
The path to the file, to which we will export the charts from the experiment result.
This should be done in the new constant:
public static final String RESULT_EXPORT_FILENAME = "C:/api_tutorial/%s dashboard data.xlsx";
Now let's change the experiment's end date.
In the opened ApiTutorialPhase3.java class file scroll to Step #5. All the previous steps are the same that we have worked on in phase 2 of this tutorial.
In Step #5 we move the experiment's ending date to June 1st 2023.
// 5. Define a new ending date for the Simulation experiment
// The new newStopDate variable with the assigned ending date: June 1st 2023
var newStopDate = LocalDateTime.of(2023, 6, 1, 0, 0, 0);
// Message showing the original ending date, and the new ending date
System.out.println("Old ending date: " + simulationRunConfiguration.getStopDate() + ",\nNew ending date:" + newStopDate);

// The new customEndType variable with the required experiment's parameter assigned to it via the getCustomEndTypeProperty() method.
ApiIdNameObject customEndType = getCustomEndTypeProperty(api, simulationRunConfiguration);
// The Custom period option is passed to the experiment's Experiment end parameter
simulationRunConfiguration.setTimeTypeEnd(customEndType);
// The new ending date is passed to the experiments' End date parameter
simulationRunConfiguration.setStopDate(String.valueOf(newStopDate));
Step #6 is required to update the experiment parameters, since we did it locally and anyLogistix Professional Server needs to be notified about the changes.
// 6. Apply all changes sending them to ALX
// The updateExperimentRunConfiguration() method notifies our server about the changes
simulationExperiment = (ApiSimulationRunConfigurationWrapper) api.updateExperimentRunConfiguration(simulationExperiment);
// To check new experiment settings we update the value of the simulationRunConfiguration variable via the getConfiguration() method,
// which returns the current (new) configuration of the Simulation experiment
simulationRunConfiguration = simulationExperiment.getConfiguration();
// And finally we add the message showing the date used for the experiment
System.out.println("Applied new ending date: " + simulationRunConfiguration.getStopDate());
anyLogistix interface shows messages and validation errors, which are not available for us here without the interface.
We will add logic to step #7 that will trace experiment execution and notify us if errors occur.
// 7. Run Simulation experiment
// This section runs the experiment. No changes are required here
System.out.println("Simulation experiment started...");
ApiExperimentResult simExperimentResult = api.runExperimentSynchronously(simulationRunConfiguration.getId());
System.out.println("Simulation experiment completed...");


// Here we add the condition that outputs a message in the console if errors occur
if (simExperimentResult.getValidationStatus() == HAS_ERRORS) {
    System.err.println(toStringValidationErrors(api, scenarioData));
    return;
}
We will assume that we want to export charts from the Profit and Loss Statement tab of the received result.
Scroll to Step 9 to find the API request that does the job:
// 9. Find the required dashboard page and get its data.
// Here we create a new page variable with the getExperimentDashboardPage() method as its assigned value.
// The method's arguments return the dashboard page (from the result returned by the getExperimentResultId() method),
// whose name fully matches the "Profit and Loss Statement" string
var page = api.getExperimentDashboardPage(
        simExperimentResult.getExperimentResultId(), true, "Profit and Loss Statement");
// Here we create a new path variable that contains the name of the file (stored in the RESULT_EXPORT_FILENAME constant)
// that the charts should be exported to. This variable will be later used to open the file
var path = String.format(RESULT_EXPORT_FILENAME, page.getName());
// And now we use the exportDashboardPage() method with arguments that return array of bytes from the required page (page.getId()) of the
// specific experiment result (simExperimentResult.getExperimentResultId())
var exportResult = api.exportDashboardPage(simExperimentResult.getExperimentResultId(), page.getId());
Now we will move on to step 10 to save the received data to the file:
// 10. Save the data, then open the MS Excel file
var outputFile = new File(path);
try {
    // We use the write() method with two arguments, allowing us to write array of bytes (exportResult) to the previously defined file (outputFile.toPath()).
    Files.write(outputFile.toPath(), exportResult);
    // To check that the data was saved we will use the open() method with the outputFile argument to open the MS Excel file
    Desktop.getDesktop().open(outputFile);
    // And to back it up a message will show what happens
    System.out.println("Exported page " + page.getName() + "\nPage data exported to " + outputFile.getName());
} catch (IOException e) {
    throw new RuntimeException(e);
}
Finally, we can run our application.
Run the application and observe the output
- Right-click ApiTutorialPhase3 class file in the project tree, then select Run from the context menu.
-
If you check the console, you will see that it worked well, we can trace that the new date has been used by the experiment, and that the page has been
exported to the MS Excel file.
The MS Excel file will open before you complete examining application output in the console.
- Application output
-
6:11:13 PM: Executing task ':ApiTutorialPhase3.main()'...

> Task :compileJava
> Task :processResources NO-SOURCE
> Task :classes

> Task :ApiTutorialPhase3.main()
API Tutorial welcomes you
class ApiProjectResponse {
    accessible: true
    creationDate: 2024-11-22T15:41:47.515954Z
    currentUserId: 9
    deleted: false
    id: 5089468
    name: API_tutorial
    ownerUserId: 9
}
Old ending date: 2019-12-31T00:00:00,
New ending date: 2023-06-01T00:00
Applied new ending date: 2023-06-01T00:00:00
Simulation experiment started...
Simulation experiment completed...
Profit and Loss Statement
	Profit and Loss Statement
	Profit, Revenue, Total Cost
	Revenue, Total Cost
Service Level
	ELT Service Level by Products (Per Product)
	ELT Service Level by Products (Per Source)
	ELT Service Level by Revenue (Per Object)
	Service Level by Products (Per Product)
	Service Level by Products (Per Source)
	Service Level by Revenue (Per Object)
Lead Time
	Lead Time
	Max Lead Time
	Mean Lead Time (Best-Mean-Worst)
Available Inventory
	Available Inventory
	Available Inventory Including Backlog
	Average Daily Available Inventory
	Average Daily On-hand Inventory
	On-hand Inventory
Peak Capacity
	Peak Capacity
	Peak Capacity
Fulfillment
	Demand Placed, Fulfillment Received (Accumulative)
	Demand Placed, Fulfillment Received (Accumulative, Per Object)
	Demand Placed, Fulfillment Received (Daily)
	Demand Placed, Fulfillment Received (Daily, Per Object)
	Demand Received, Fulfillment Shipped (Accumulative)
	Demand Received, Fulfillment Shipped (Daily)
Used Vehicles
	Average Number of Vehicles Used
	Max Number of Vehicles Used
	Shipped Vehicles
Exported page Profit and Loss Statement
Page data exported to Profit and Loss Statement dashboard data.xlsx
-
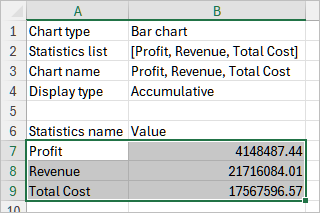
Now examine the opened Profit and Loss Statement dashboard data.xlsx file, which contains three sheets, one per each chart
of the exported page (Line chart, Table, Bar chart).
To compare the results we will:
-
Open the Bar chart sheet and select the statistics names and their values:
-
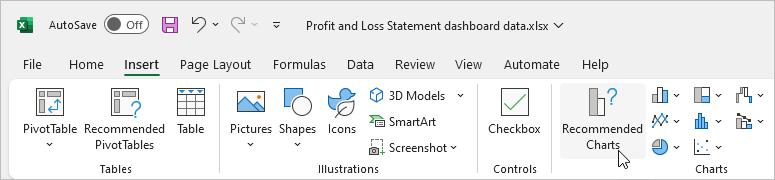
Click the Insert menu and select Recommended charts from the ribbon.
-
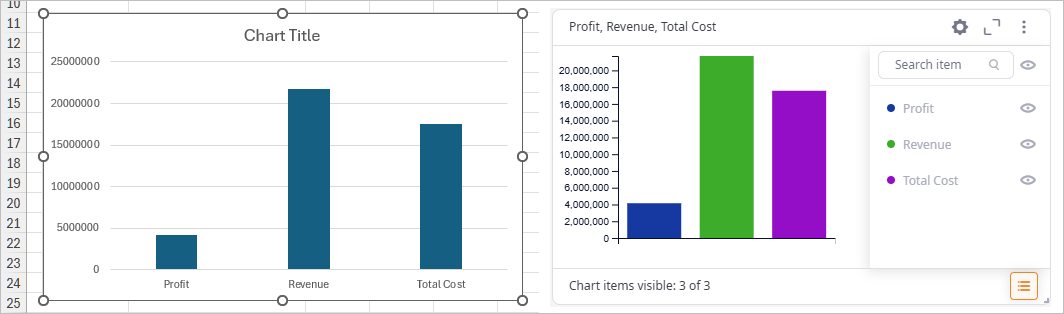
In the opened dialog box leave the selected by default Clustered Column option, and click OK.
The selected data will be visualized in a chart.
As you can see, it is the same output that we have in anyLogistix.
-
Open the Bar chart sheet and select the statistics names and their values:
-
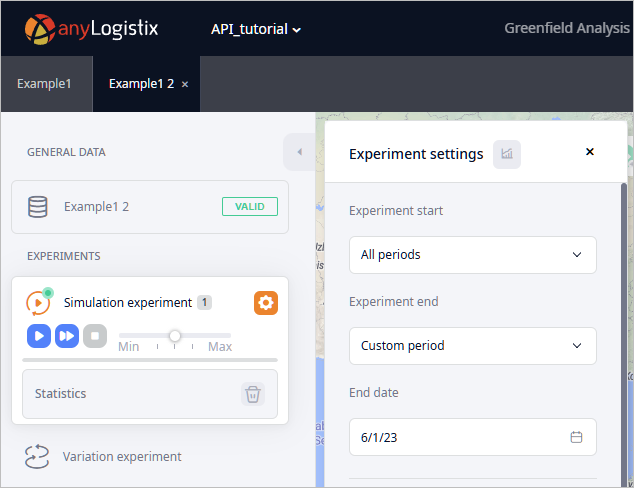
Finally, open the web browser page with anyLogistix Professional server.
Click the Example1 2 scenario tab, then select the Simulation experiment tile.
The experiment's parameters section will be open by default, and you will be able to see that the Experiment end parameter is set to
Custom period, and there is the End date parameter that is set to 6/1/23.
Additionally you may create API request to close the project after each run. This may be required if you are using a shared project and someone else might need access to it. The project will not be available to other users unless you leave it by closing it.
For the same reason you may want to remove the imported scenario from the project.
// 11. Remove scenario and Close project
// Removes scenario by its ID
api.removeScenarioById(scenarioData.getId());
// Closes the project
var closeProjectOpenResponse = api.closeProject();
// Shows a message confirming that the project has been closed
System.out.println(closeProjectOpenResponse);
We have successfully completed API tutorial.
-
How can we improve this article?
-