The results are available in the dashboard below the experiment's view in the form of statistics, distributed through the pages on the left (each page refers to a certain type of statistics). If required, you can rename, remove a page, or export the content of the page's statistics to an MS Excel file:
- Target Service Level — shows the service level statistics in Line and B-M-W line type of charts. The type of the statistics shown here depends on type of the specified Target Service Level. For example, if you select Service Level by Products as the Target Service Level, this page will contain Service level by Products statistics.
- Events and Recovery — shows detailed statistics on the events that took place and the recovery time, during which the supply chain was running below the specified Failure Service Level.
- Total Cost — shows detailed statistics on all the incurred expenses.
- Revenue — shows statistics on the income generated by a facility from selling products to Customers.
- Profit — shows the expected profit, which is calculated as Total cost minus Revenue received.
- Fulfillment Received (Products) by Customer — shows statistics on the total quantity of product items received by the customer.
- Demand Received (Dropped Products) — shows statistics on the quantity of product items contained in the lost orders.
- Demand Placed (Dropped Products) by Customer — shows statistics on the quantity of product items contained in the orders that a customer could not place.
- Fulfillment Received (Products On-time) — shows statistics on the quantity of product items delivered within the specified Expected lead time (see the Demand table).
- Fulfillment (Late Products) — shows statistics on the quantity of product items, which failed to arrive within the specified Expected lead time (see the Demand table).
- Mean lead Time — shows statistics on the mean delivery time.
- Max Lead Time — shows statistics on the max delivery time.
- Bullwhip Effect by Product — shows statistics on the supply chain inefficiencies, where orders sent to the manufacturer and supplier create larger variance then the sales to the end customer.
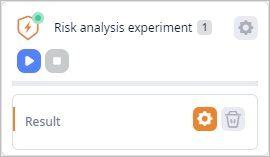
To see experiment results
- Run the experiment.
- Once the experiment is completed, a new Result item will be created below the
Risk analysis experiment tile.

- Click Result to analyze the result, if you have previously navigated away from it.
-
How can we improve this article?
-

