

If the Experiment settings panel is not open, click
 in the experiments controls.
- Experiment duration — the period of time that will be processed by the experiment.
-
All periods — [this option is set by default] Experiment will consider all periods specified in the
Periods table.
The actual experiment duration is defined as the starting date of the first period and the ending date of the last period.
-
Selected periods — experiment will consider only the periods that you specify in the
Start period and End period fields:
- Start period — [visible if Selected periods option is selected] specify the period, the starting date of which will be used as the starting date of the experiment.
- End period — [visible if Selected periods option is selected] specify the period, the ending date of which will be used as the ending date of the experiment.
The experiment duration will constitute the whole period between the starting date of the period specified in the Start period field and the ending date of the period specified in the End period field.
-
All periods — [this option is set by default] Experiment will consider all periods specified in the
Periods table.
-
Ignore straight routes — [disabled by default] defines if the experiment considers straight routes or ignores them.
The GFA with roads experiment considers actual roads. If data on a certain route cannot be obtained (e.g. the road does not exist), the route is treated as a straight line connecting two objects. This parameter defines if the experiment considers such straight routes or ignores them (i.e., there's no connection between the objects).
- Analyzed by a number of sites — specify the number of sites that you would like to use in your supply chain. The GFA with Roads experiment will find the optimal locations for the specified number of sites.
- Distance step for statistics — statistics will be shown for sites at every specified distance step.
-
Suppliers to sites transportation discount, %
— allows you to vary transportation cost from a supplier to distribution centers (both existing and the ones the experiment will generate).
The larger the discount, the less influence a supplier has on a site location, and vice versa. - Minimum population — limits the list of cities (by their population), in which distribution centers can be placed. If the population of the city is less than the specified value, it will not be considered by the experiment.
- Distance between cities — limits the range within clusters for defining cities, in which distribution centers can be placed. The value is expressed in the units defined in the Distance stats unit parameter of this experiment's settings.
- Optimization time limit — sets the maximum time you would like to allot to defining one solution. The default value is 600 seconds.
- Product stats unit — the measurement unit of products within this experiment.
- Distance stats unit — the measurement unit of distance within this experiment.
- New site icon — opens the Define The New Icon dialog box, which allows you to create new icon, and set it to all distribution centers created by the GFA experiment.
-
Clustering mode — the mode the experiment uses to determine the possible site locations.
Learn more how clustering modes work.
- Define sites then optimize customers — [selected by default] the basic evaluation algorithm, allowing the experiment to determine the possible site locations.
- Optimize while defining sites — provides more accurate results. Requires more time to complete the experiment.
-
Advanced settings — [available if the Show advanced experiment settings
checkbox is selected in the anyLogistix settings]
a set of additional parameters that affect calculation logic.
- Parameters
-
Use the parameters carefully to fine-tune the experiment. Note that changes you make may significantly increase calculation time.
 — click to reset the advanced experiment settings.
- Max iterations — number of iterations with a random set of initial cluster points.
- Max heat length — limits heat map for demand. It is calculated as:
max(2, min(maxHeatLength, nLocations / divider)).
- Divider — changes heat map granularity.
The table allows you to specify the groups of customers / sites or both types of objects to be considered during the GFA experiment. For more details refer here. The table contains the following columns:
- Enlarge — expands the table window. To close the expanded window, click
 .
. - # — shows the ordinal numbers, denoting the order of the table records.
- Destination — contains groups (either default or user-defined) of the available customers / sites involved in the scenario's supply chain.
- Included — shows the current status of the group, i.e., whether it is considered or not during the GFA experiment.
Types of objects to consider
- Customers — the experiment will find the optimal locations for sites supplying the selected customers.
- Sites — the experiment will find the optimal locations for super sites, supplying the selected sites.
- Combination of customers and sites — the experiment will find the optimal locations for super sites that will be supplying the selected objects.
You might need to redesign the existing sourcing policies (defined in the Sourcing table) to avoid crosslinking of locations from the selected groups of objects. For details refer here.
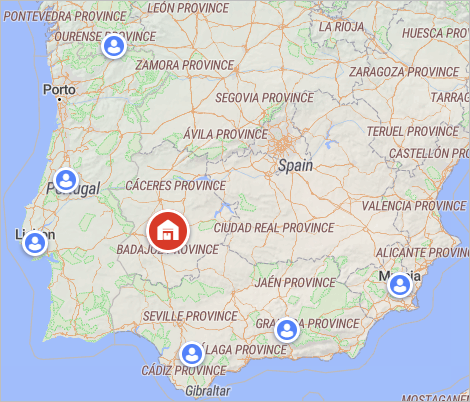
Defining a super site location for a distribution center and several customers
For example, we have a supply chain in Spain with one distribution center and six customers (see screenshot below). The distribution center is supplying three customers in the western part of Spain (next to Ourense, in Portugal, and in Lisbon). You want to find the optimal location for a sourcing site that will be supplying the existing distribution center and the three clients in the northern part of Spain.
- Navigate to the Sourcing table and make sure that the customers from the northern part are not connected to the existing distribution center.
- Navigate to the Groups
table and create either of the following (the created groups will be available in the table of
Destinations):
- Group containing all the required objects (the existing distribution center and the three northern customers). This will add one record to the Destination column in the table of Destinations.
- Two groups, one with the existing distribution center, and the other one with the three northern customers. This will add two records to the Destination column in the table of Destinations.
- Navigate to the experiment settings and select the required group(s) of objects. The experiment will find the optimized location for the super site considering the existing distribution center and the specified customers.
To offer the required results, the experiment processes scenario data in several steps, applying the selected clustering mode during the last step:
- GFA algorithm estimates coordinates of clusters' centers.
- The list of potential cities is created. It comprises cities in the vicinity of the clusters' centers. These potential cities are locations for the distribution centers the experiment will generate.
-
The experiment selects optimal locations from the list of potential cities considering the selected clustering mode:
-
Define sites, then optimize customers — in this mode the experiment uses clusters with customers obtained in step 1 to select optimal locations from the list of potential cities.
- The advantage of this mode is the processing speed (since the experiment needs only to pick the optimal cities from the list).
- The drawback is that the group of customers is optimal only for the cluster's coordinates obtained in step 1, but not for the selected locations (step 3). This drawback is partially neutralized by the final step (after the locations are selected), where the clustering algorithm is initiated again, but it now uses coordinates of the selected locations as the static centroids.
-
Optimize while defining sites — clusters with customers obtained in step 1 is not considered in this mode. Clustering is done by the CPLEX. This means that the experiment selects locations (step 3) and simultaneously estimates customers for the selected locations.
- The advantage of this mode is the accuracy of the received result. Since the experiment simultaneously solves two problems it can vary a greater amount of input data, thus minimizing the objective function.
-
The drawback is that depending on the amount of the input data this mode may require significantly more time than the Define sites, then optimize customers mode.
The optimal solution may not be found, if data processing time exceeds the
Optimization time limit,sec value.
In this case the experiment will consider the optimal solution to be the best one that was found within the allotted time.
Such solution may be (but not necessarily) worse, than the one obtained using the Define sites, then optimize customers mode.
To allow the experiment spend more time finding the optimal solution, adjust the default Optimization time limit,sec value.
-
-
How can we improve this article?
-