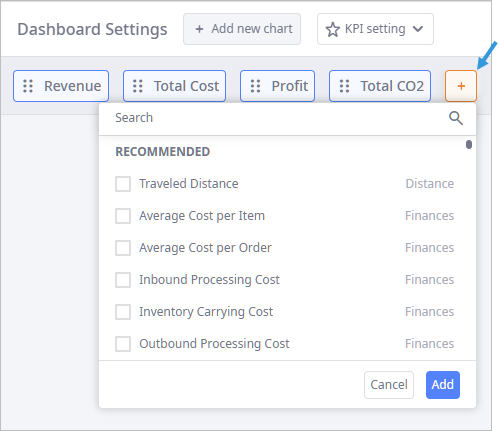
KPI metrics are added to the KPI ribbon in form of tiles, which you can later reorder, enlarge, remove.
Each KPI metric is an aggregated value of the corresponding statistics. The Total income KPI metric is not available as a statistics in the dashboard, also Profit and Total Cost KPI metrics are not available as dashboard statistics in the Network optimization experiment.
To add a KPI metric to the ribbon
-
In the KPI ribbon click
 Add KPI metrics
to open the drop-down list with available metrics:

-
Find the required statistics by doing either of the following:
- Type its name in the Search field.
- Scroll the list.
The list of metrics that you can choose from depends on the experiment you are using.
The list does not contain:
- Custom tables.
- Preset statistics.
- Statistics that are disabled in the statistics configuration dashboard.
- KPI metrics that are already added to the KPI ribbon.
-
Select the checkboxes next to the required metrics.
You can select multiple metrics.
All the selected metrics will be added to the KPI ribbon in separate tiles.
The list comprises two section:
- Recommended — the most frequently used metrics.
- Other — the rest of the metrics available for this experiment type.
-
Click Add to add metrics to the ribbon.
The added metrics become unavailable in the list until they are removed from the ribbon.
-
How can we improve this article?
-

