

Based on the data provided in the scenario tables, the NO results offer:
- Exact locations for the distribution centers/warehouses.
- Sourcing policies — where and which product to buy.
- Set of statistics allowing you to analyze the received results.
Experiment result with all the possible combinations is available in the Iterations panel.
All the details on each iteration are available in the dashboard below the experiment's view in the form of statistics distributed through the pages on the left (each page refers to a certain type of statistics). If required, you can rename, remove a page, or export the content of the page's statistics to an MS Excel file.
To see experiment results
- Run the experiment.
-
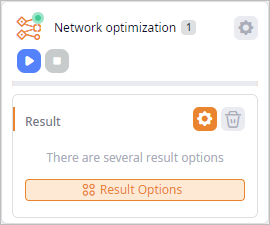
Once the experiment is completed, a new Result item will be created below the
Network optimization tile.
-
Click Result to analyze the results.
Network optimization results data cannot be edited unless you convert it to a scenario.
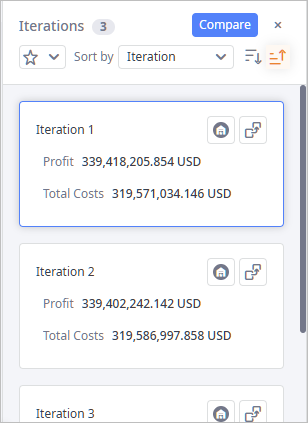
The Iterations panel contains iterations of the selected result. The basic data of each iteration is shown on an iteration card. The top card contains iteration with the best result in terms of profit.
Click the required iteration card to display the supply chain from that card on the map.
To hide / show the Iterations panel
-
Click the
 Iterations control on the currently selected output item to toggle the panel's visibility.
The panel contains:
- Controls — use controls to manage iteration cards.
- Iteration cards — one card per iteration a result contains. Cards contain a set of KPI metrics to instantly observe the efficiency of the supply chain within a specific result iteration.
Iteration controls
The header of the Iterations panel comprises:
- Iterations — the title of the panel with the number of iterations this result contains.
-
 — [available only in the anyLogistix Professional and anyLogistix Professional Server editions]
opens the Iterations Comparison dialog box, which allows you to compare iterations of this result.
— [available only in the anyLogistix Professional and anyLogistix Professional Server editions]
opens the Iterations Comparison dialog box, which allows you to compare iterations of this result.
-
 — closes the Iterations panel (you can open it later).
-
 — opens the drop-down list of KPI metrics that can be added to the iteration cards.
-
Sort by — the sorting type of iteration cards.
By default the cards are sorted by the iteration name (it contains the ordinal number).
The statistics, by which the sorting is done, is highlighted within the card and is placed at the top.
-
 — select to reorder the sorted cards in the descending order.
-
 — [selected by default] reorders the sorted cards in the ascending order.
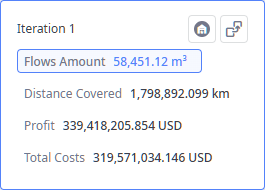
Iteration cards
Iteration cards contain a set of KPI metrics to instantly observe the efficiency of the supply chain within a specific result iteration. The content of iteration cards is user-defined.
The iteration card comprises:
- Title — iteration name with its ordinal number.
-
 — shows the list of facilities in this iteration.
-
 — opens the
Convert Result dialog box, which allows you to convert the current iteration into a new scenario.
— opens the
Convert Result dialog box, which allows you to convert the current iteration into a new scenario.
- The list of user-defined KPI metrics.
List of facilities in this iteration
The drop-down list shows the inclusion type that was assigned to the facilities by the experiment within this iteration.
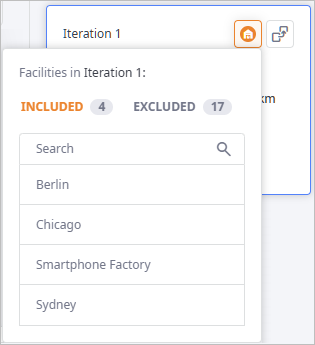
The drop-down list comprises:
- Title — iteration name with its ordinal number.
-
Tabs with indication of the number of facilities it contains:
- Included — the facilities that are included in the solution offered in this iteration. The number next to the tab name shows the quantity of included facilities.
- Excluded — other facilities that are excluded from the solution offered in this iteration. The number next to the tab name shows the quantity of excluded facilities.
- Search — use the search field to filter the list of facilities.
- Facilities. Each facility item comprises the name of the facility and the number of iterations (that are added to the comparison table) containing this facility.
- All — this page contains all the predefined experiment's statistics in one place.
- Product Flows — Shows detailed statistics on all the flows of the supply chain within the specified period of time.
- Site State — shows detailed statistics on the cost of opening/closing a site.
- Other Costs — shows detailed statistics on all other costs incurred within the specified period of time.
- Operating Sites — shows detailed statistics on costs of the supply chain sites during all periods.
- Storage by Product — shows detailed statistics on costs for storing products within the specified period of time.
- Production Cost — shows detailed statistics on costs incurred during the production process.
- Production Flows — shows detailed statistics on the flows involved in the production process.
- Shared Flow Constraints — shows detailed statistics on flow constraints (available if at least one of the "Expanded..." columns is disabled in the Product Flows table).
- Shared Storages Constraints — shows detailed statistics on storages constraints (available if at least one of the "Expanded..." columns is disabled in the Product Storages table).
- Demand Fulfillment — shows detailed statistics on demand within the supply chain during the specified period of time.
- Vehicle Flows — shows detailed statistics on the vehicles types used to deliver goods within the supply chain.
- Named Expressions — shows detailed statistics on the user-defined constraints within the supply chain.
- Objective Members — shows the result of expression, defined in the Objective Members table.
- Overall Stats — shows detailed statistics on all the incurred expenses that are deducted from the received revenue within the specified period of time.
-
How can we improve this article?
-