

- Bullwhip Effect by Product
- Demand Fulfillment
- ELT Service Level by Orders
- ELT Service Level by Products
- ELT Service Level by Revenue
- Flow Utilization
- Gates Utilization
- Production Line Utilization
- Service Level by Orders
- Service Level by Products
- Service Level by Revenue
- Space Utilization (DC with Storages)
- Staff Utilization (DC with Staff)
- Staff Utilization (DC with Storages)
- Storage Utilization
- Vehicle Capacity Utilization
- Vehicle Capacity Utilization
Statistics related to this group provide detailed information on the utilization of various supply chain elements during the experiment run, as well as quality of provided delivery services (based on the analysis of the received ( Fulfillment Received (Orders On-time), Fulfillment Received (Products On-time), Fulfillment (Late Orders), Fulfillment (Late Products)), sent ( Demand Placed (Orders) by Site ) or initially dropped ( Demand Placed (Dropped Products) by Customer, Demand Placed (Dropped Orders) by Customer) orders/ordered products).
Shows statistics on product demand variability amplification during the supply chain simulation: from the point of actual (final) product items demand to the point of origin (distribution center, factory).
- BWE > 1 means that outgoing variability prevails over the incoming
- 0 =< BWE < 1 means that incoming variability prevails over the outgoing
- BWE = 1 means there is NO bullwhip effect
- BWE = -1 means that incoming variability is 0
The bullwhip effect is defined as:
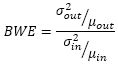
Where:
 — variance in demand
 — expected value
 — outbound orders
 — inbound orders
The data is:
- Updated each model day.
- Collected per:
- Type — the type of object the data is collected on (DC, Factory).
- Object — the name of the object (distribution center, factory) the data is collected on.
- Product — the products the data is collected on.
- Period — the period, for which the data is calculated.
[Used within the NO and Cost to serve experiments only] Shows the demand fulfillment. It is calculated as Percentage / 100.
The data is:
- Updated at the end of every iteration.
- Collected per:
-
Iteration — refers to the specified number of the best solutions.
In other words, it enumerates the found solutions.
E.g. 1 — first solution, 2 — second solution and so on.
- Object — the name of the object the data is collected on.
- Product — the products the data is collected on.
- Period — the period, for which the data is calculated.
-
Iteration — refers to the specified number of the best solutions.
In other words, it enumerates the found solutions.
Shows the service level based on the ratio of on time orders to the overall number of outgoing orders.
The ELT Service Level by Products and the ELT Service Level by Revenue statistics are calculated in the same way, the difference lies in the data extracted from the calculation:
- ELT service Level by Products — shows ratio of products delivered on time to the overall number of products shipped. The data on products is taken from the processed orders.
- ELT service Level by Revenue — shows the ratio of on time orders to the overall number of outgoing orders in terms of money received.
The ELT Service Level by Orders statistics shows service level calculated based on the expected lead time.
The value is defined as:

Where:
- number of on time orders — the number of orders that were delivered within the expected lead time.
- number of outgoing orders — the sum of on time and delayed orders. The value does not include placed orders that are not yet shipped, delayed or dropped (such orders can still be delivered within the Expected lead time specified in the Demand table). Note that for ELT-based service level, dropped orders are excluded from outgoing orders if backorder policy for the selected customer is set to Not Allowed (backorder policy is defined in the Demand table).
The data is:
- Updated each time an order is received / delayed / dropped.
- Collected per:
- Object — the name of the object (Customer) the data is collected on.
- Product — the products the data is collected on.
- Source — the source that supplied the object with the requested product
- Period — the period during which the data is collected.
Shows the service level based on the ratio of products delivered on time to the overall number of products shipped. The data on products is taken from the processed orders. The ELT Service Level by Orders and the ELT Service Level by Revenue statistics are calculated in the same way, the difference lies in the data extracted from the calculation:
- ELT service Level by Orders — shows ratio of on time orders to the overall number of outgoing orders.
- ELT service Level by Revenue — shows the ratio of on time orders to the overall number of outgoing orders in terms of money received.
Shows service level calculated based on the expected lead time.
The value is defined as:

Where:
- products in the on time orders — the amount of products from the orders that were delivered within the expected lead time.
- products in the outgoing orders — the sum of products from the on time and delayed orders. The value does not include placed orders that are not yet shipped, delayed or dropped (such orders can still be delivered within the Expected lead time specified in the Demand table). Note that for ELT-based service level, dropped orders are excluded from outgoing orders if backorder policy for the selected customer is set to Not Allowed (backorder policy is defined in the Demand table).
The data is:
- Updated at the end of the day.
- Updated each time an order is received / delayed / dropped.
- Collected per:
- Object — the name of the object (Customer) the data is collected on.
- Product — the products the data is collected on.
- Source — the source that supplied the object with the requested product
- Period — the period during which the data is collected.
Shows the service level based on the ratio of on time orders to the overall number of outgoing orders in terms of money received. The data on products is taken from the processed orders. The ELT Service Level by Orders and the ELT Service Level by Products statistics are calculated in the same way, the difference lies in the data extracted from the calculation:
- ELT service Level by Orders — shows ratio of on time orders to the overall number of outgoing orders.
- ELT service Level by Products — shows ratio of products delivered on time to the overall number of products shipped. The data on products is taken from the processed orders.
Shows service level calculated based on the expected lead time.
The value is defined as:

Where:
- value of products in the on time orders — the value of products from the orders that were delivered within the expected lead time.
- value of products in the outgoing orders — the sum of values of products from the on time and delayed orders. The value does not include placed orders that are not yet shipped, delayed or dropped (such orders can still be delivered within the Expected lead time specified in the Demand table). Note that for ELT-based service level, dropped orders are excluded from outgoing orders if backorder policy for the selected customer is set to Not Allowed (backorder policy is defined in the Demand table).
The data is:
- Updated at the end of the day.
- Updated each time an order is received / delayed / dropped.
- Collected per:
- Object — the name of the object (Customer) the data is collected on.
- Product — the products the data is collected on.
- Source — the source that supplied the object with the requested product
- Period — the period during which the data is collected.
[Used within the NO and Cost to serve experiments only] Shows the deviation from the specified throughputs. It is calculated as Percentage / 100. The data is:
- Updated at the end of every iteration.
- Collected per:
- Iteration — refers to the specified number of the best solutions.
In other words, it enumerates the found solutions.
E.g. 1 — first solution, 2 — second solution and so on.
- Product — the product used within the flow.
- Vehicle type — the vehicle type used to perform delivery.
- Period — the period, during which the data is collected.
- From — the source of the flow.
- To — the destination of the flow.
- Iteration — refers to the specified number of the best solutions.
In other words, it enumerates the found solutions.
Shows statistics on the ratio of the time the gates are busy to all the time of the gates.
The value is defined as:
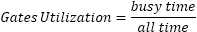
Where:
- busy time — the sum of busy time during the day.
- all time — the sum of all busy and the idle time during the day.
The data is:
- Collected per:
- Object — the name of the object (customer, distribution center, factory, supplier) the data is collected on.
- Staff type — the loading/unloading areas of the corresponding object.
- Period — the period, for which the data is calculated.
Shows statistics on the ratio of the Production Line Busy Time to all time of the production line.
The value is defined as:
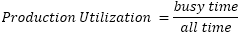
Where:
- busy time — the sum of time the production line is busy.
- all time — the sum of production line's busy time and idle time.
The data is:
- Updated at the end of each day, showing produced items.
- Collected per:
- Type — the factory the data is collected on.
- Object — the name of the factory the data is collected on.
- Production line — the production line the data is collected on.
- Period — the period, during which the data is collected.
Shows Service Level, the estimation of which is based on the number of unsuccessful orders.
The unsuccessful orders are:
- The placed orders requiring the quantity of products that is not available at the facility at the time when this order is placed
- The dropped orders
The value is defined as:

Where:
- number of successful orders — orders that were successfully fulfilled.
- sum of all orders placed for this facility — here belong both successful and unsuccessful orders.
The data is:
- Updated at the end of the day.
- Updated each time an order is received / dropped.
- Collected per:
- Object — the name of the object (Customer) the data is collected on.
- Product — the products the data is collected on.
- Source — the source that supplied the object with the requested product.
- Period — the period during which the data is collected.
Shows Service Level, the calculation of which is based on the number of unsuccessful orders in terms of products these orders contain.
The unsuccessful orders are:
- The placed orders requiring the quantity of products that is not available at the facility at the time when this order is placed
- The dropped orders
The value is defined as:

Where:
- products in the successful orders — the amount of products in the orders that were successfully fulfilled.
- sum of products in all orders placed for this facility — here belong products from both successful and unsuccessful orders.
The data is:
- Updated at the end of the day.
- Updated each time an order is received.
- Collected per:
- Object — the name of the object (Customer) the data is collected on.
- Product — the products the data is collected on.
- Source — the source that supplied the object with the requested product.
- Period — the period during which the data is collected.
Shows service level, which is calculated based on the amount of money which has not been received because of lost orders.
The value is defined as:

Where:
- products in the dropped orders — the amount of products in the dropped orders and the placed orders requiring the quantity of products that is not available at the facility at the time when this order is placed.
- product selling price — selling price for a single product unit (defined in the Selling Price column of the Products table).
- sum of products in all orders placed for this facility — here belong products from both successful and unsuccessful orders.
The data is:
- Updated at the end of the day.
- Updated each time an order is received / delayed / dropped.
- Collected per:
- Object — the name of the object (Customer) the data is collected on.
- Product — the products the data is collected on.
- Source — the source that supplied the object with the requested product.
- Period — the period during which the data is collected.
Shows statistics on the ratio of the occupied storage space to the total available space.
The value is defined as:
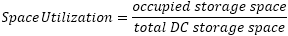
Where:
- occupied storage space — occupied storage space of the distribution center with storages.
- total DC storage space — the total space of the distribution center with storages.
The data is collected per:
- Object — the name of the object (distribution center) the data is collected on.
- Zone — the object zones of the corresponding object.
Shows statistics on the ratio of the staff occupied time to all time.
The value is defined as:
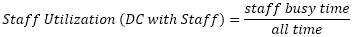
Where:
- staff busy time — the time during which the staff is busy (see Staff Busy Time (DC with Staff)).
- all time — the sum of staff busy and idle times during the day. For Idle time see Staff Idle Time (DC with Staff).
The data is collected per:
- Object — the name of the object (distribution center) the data is collected on.
Shows statistics on the ratio of the occupied staff units to the total staff units of the distribution center with storages.
The value is defined as:

Where:
- busy staff units — the occupied staff of the distribution center with storages.
- available staff — the total available staff of the distribution center with storages.
The data is collected per:
- Object — the name of the object (distribution center) the data is collected on.
- Staff type — the staff types of the corresponding object.
[Used within the NO and Cost to serve experiments only] Shows statistics on storage utilization. It is calculated as Percentage / 100.
The data is:
- Updated at the end of every iteration.
- Collected per:
-
Iteration — refers to the specified number of the best solutions.
In other words, it enumerates the found solutions.
E.g. 1 — first solution, 2 — second solution and so on.
- Object — the name of the object the data is collected on.
- Product — the products the data is collected on.
- Period — the period, for which the data is calculated.
-
Iteration — refers to the specified number of the best solutions.
In other words, it enumerates the found solutions.
[Used within the NO and Cost to serve experiments only] Shows statistics on the vehicle capacity utilization used for transportation. It is calculated as Total Products Flow / (Vehicle Trips * Vehicle Capacity). The data is:
- Updated at the end of every iteration.
- Collected per:
- Iteration — refers to the specified number of the best solutions.
In other words, it enumerates the found solutions.
E.g. 1 — first solution, 2 — second solution and so on.
- Vehicle type — the vehicle type used to perform delivery.
- Period — the period, during which the data is collected.
- From — the source of the flow.
- To — the destination of the flow.
- Iteration — refers to the specified number of the best solutions.
In other words, it enumerates the found solutions.
[Used within SIM experiment only] Shows statistics on the ratio of the volume of all shipments to the capacity of all vehicles used for transportation.
The value is defined as:

Where:
- volume of all shipments — the summarized volume of all shipments transferred by the vehicles
- summarized capacity of involved vehicles — the summarized capacity of the vehicles that were delivering the shipments .
The data is:
- Collected per:
- Type — the type of object the data is collected on (DC, Factory, Supplier).
- Object — the name of the object (distribution center, factory, supplier) the data is collected on.
- Vehicle type — the vehicle type used to perform delivery.
- Period — the period, for which the data is calculated.
-
How can we improve this article?
-